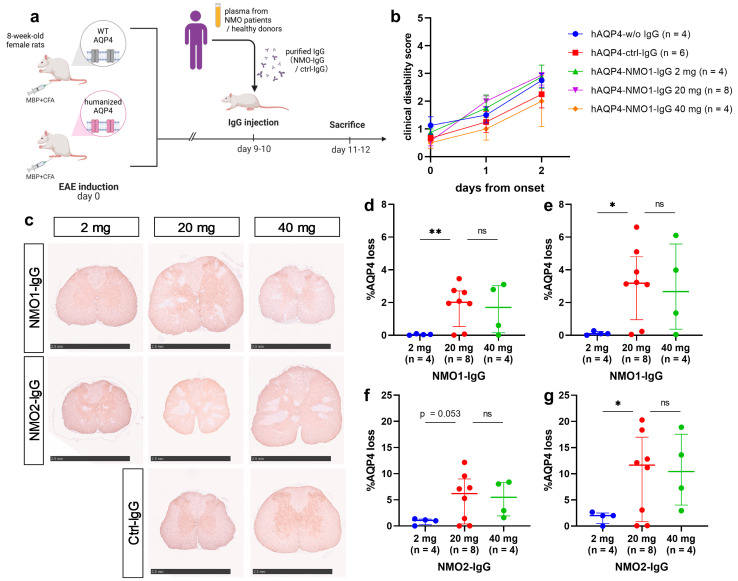
Figure 2.
AQP4 loss lesions in hAQP4 rats induced by NMOSD patient-derived IgGs were dose-related. (a) Summary of the experimental protocol. Created with BioRender.com. (b) Clinical courses of the rats after injection with patient-derived IgGs or ctrl-IgG. Clinical disability scores of the hAQP4 rats without IgG injection (hAQP4-w/o IgG, blue), hAQP4 rats transferred with ctrl-IgG (hAQP4-ctrl-IgG, red), hAQP4 rats transferred with NMO1-IgG (hAQP4-NMO1-IgG) 2 mg (green), hAQP4-NMO1-IgG 20 mg (purple), and hAQP4-NMO1-IgG 40 mg (orange) on the day of IgG injection (day 0) and after 2 days. Values are mean ± SEM of each group. (c) AQP4 staining of the spinal cord sections in each group. Each scale bar = 2.5 mm. (d–g) Size of AQP4 loss lesions in the spinal cord induced by patient-derived IgGs on the pathological examination. The percentage of AQP4 loss area was calculated in 12 slices per rat by dividing the AQP4 loss area by the whole section area. (d,f) Average percentage of the AQP4 loss area in 12 slices per rat (d) in the hAQP4-NMO1-IgG 2 mg, 20 mg, and 40 mg groups and (f) in the hAQP4 rats transferred with NMO2-IgG (hAQP4-NMO2-IgG) 2 mg, 20 mg, and 40 mg groups. Values are median ± IQR with individual points. (e,g) The average percentage of the AQP4 loss area in the slices with the three largest lesions per rat (e) in the hAQP4-NMO1-IgG 2 mg, 20 mg, and 40 mg groups and (g) in the hAQP4-NMO2-IgG 2 mg, 20 mg, and 40 mg groups. Values are median ± IQR with individual points. Statistical analyses were performed using Dunnett’s T3 test with GraphPad Prism 8.4.3. Significance is indicated as ns: not significant, * p < 0.05, ** p < 0.01.

