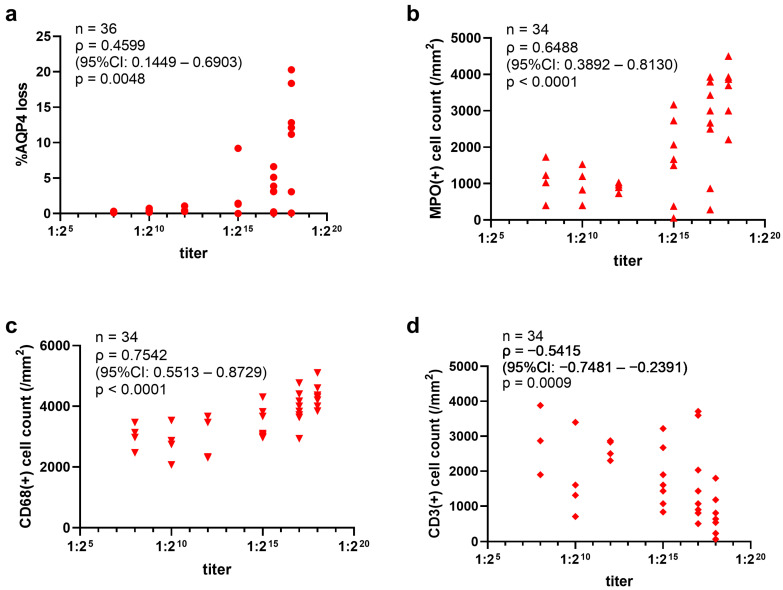
Figure 6.
The anti-AQP4 titers of NMOSD patient-derived IgGs correlated with the size of the AQP4 loss lesions and MPO-, CD68-, and CD3-positive cells infiltrating into the lesions in the hAQP4 rat model. (a) Relationship between the anti-AQP4 titers of patient-derived IgGs and the size of induced AQP4 loss lesions in the spinal cord of hAQP4 rats. The average percentage of the AQP4 loss area in the slices with the three largest lesions per rat was plotted in the graph. (b–d) Relationship between the titer of patient-derived IgGs and the density of MPO- (b), CD68- (c), and CD3-positive (d) cells in the AQP4 loss lesions. Statistical analysis was performed using Spearman’s rank correlation coefficient with GraphPad Prism 8.4.3.

