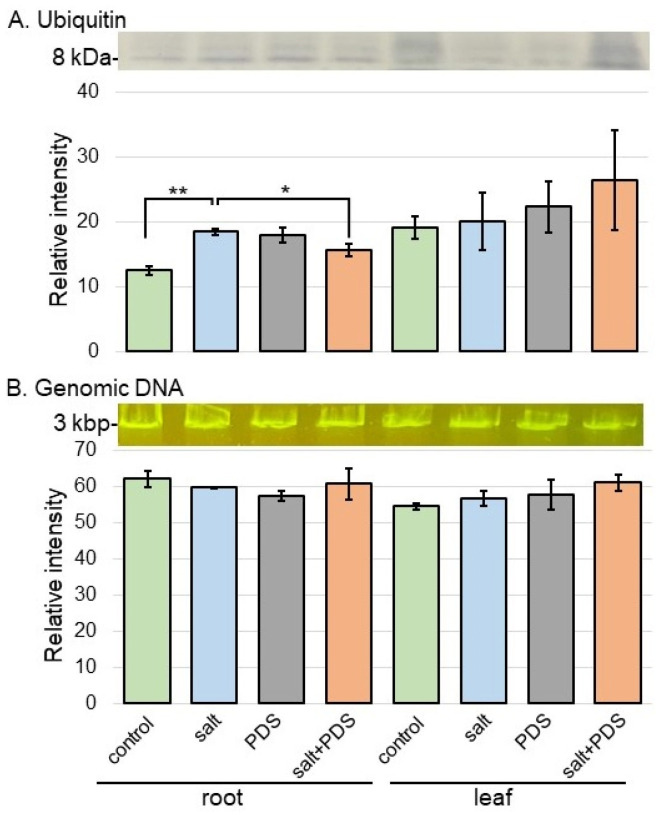
Figure 9.
Ubiquitin accumulation and DNA degradation in wheat treated with PDS solution under salt stress. (A) Proteins were separated by electrophoresis on a 12% SDS-polyacrylamide gel. Proteins blotted on the membrane were cross-reacted with anti-ubiquitin antibody. A staining pattern with Coomassie brilliant blue was used as a loading control (Figure S2). The integrated densities of the bands were calculated using ImageJ software. The data are presented as mean ± SD from three independent biological replicates (Figure S5). (B) Genomic DNA degradation in wheat treated with PDS solution under salt stress. After salt treatment, genomic DNA was extracted from root and leaf. Extracted genomic DNA was analyzed by agarose-gel electrophoresis and stained. The integrated densities of bands were calculated using ImageJ software. Data are shown as mean ± SD from three biological replicates. Student’s t-test was used to compare values between two groups. Asterisks indicate significant changes (*, p ≤ 0.05; **, p ≤ 0.01).

