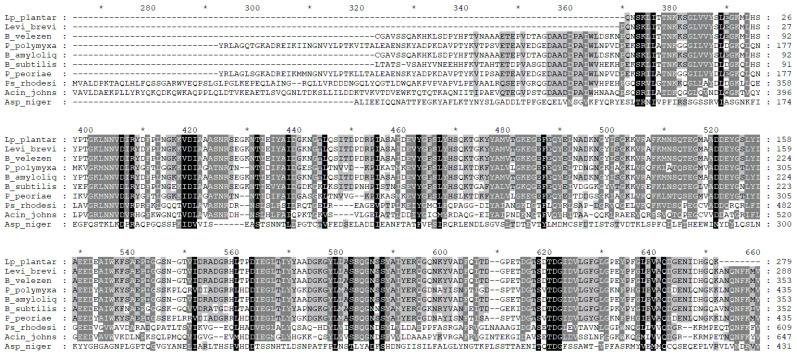
Figure 7.
Demonstration of the conservative regions in microbial phytases, determined by protein sequence alignment using the free software GeneDoc [197]. The active center residues are shown in black; the semi-identical amino acid residues are in grey, the non-identical are white; dashes indicate gaps introduced to maximize similarities; the asterisk means consecutive counting of ten amino acids. In the comparison, the protein sequences with the following NCBI GenBank accession numbers were used: AVV65758.1 (Lev. brevis); AVV65757.1 (Lp. plantarum); CP103783.1 (B. subtilis 168); WP_325085020.1 (B. amyloliquefaciens); WP_130570879 (B. velezensis); CP024795.1 (Paenibacillus polymyxa); WP_348624070 (P. peoriae); WP_348943522.1 (Acinetobacter johnsonii); WP_348739472 (Pseudomonas rhodesiae); CAK38611.1 (Aspergillus niger).

