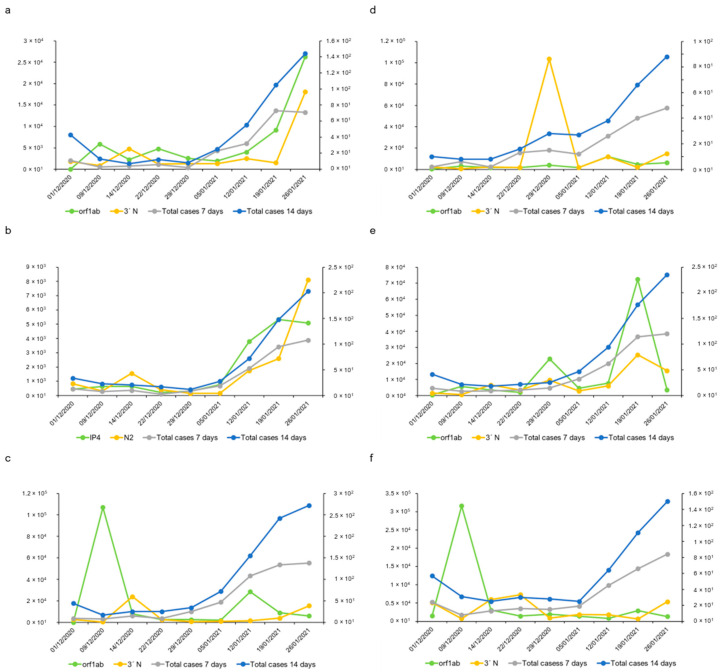
Figure 4.
Evolution of SARS-CoV-2 genome copy levels in samples collected from six urban sewers in Salamanca. (a) San José; (b) University district; (c) San Bernardo; (d) Capuchinos; (e) hospital; (f) nursing home. Values represented on the left axis refer to the estimated gc mL−1 of collected samples, while values on the right axis denote the cumulative incidence of cases diagnosed in 7 or 14 days provided by the local health authority (https://analisis.datosabiertos.jcyl.es/pages/coronavirus/, accessed on 3 October 2023).

