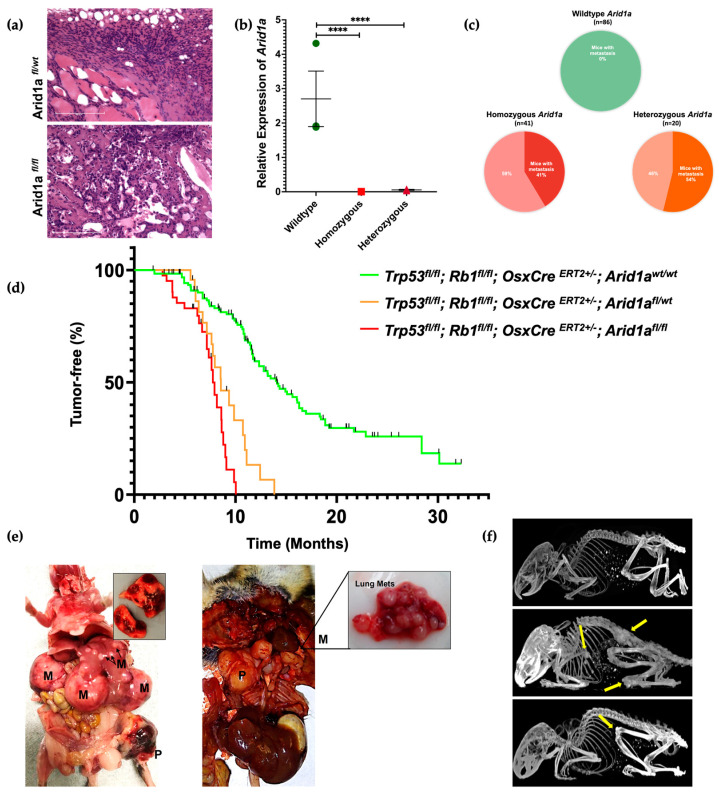
Figure 2.
In vivo Arid1a knockout resulted in a greater tumor burden and metastasis. (a) H&E staining of Arid1a homozygous (bottom) and heterozygous (top) mouse tumor tissue shows an osteosarcoma-like appearance (osteoid matrix = bright pink, scale bar 100 μm). (b) Relative expression of Arid1a in wildtype, Arid1afl/fl and Arid1afl/wt mouse tumor samples (**** p-value < 0.0001). (c) Pie chart shows the percent metastasis found in Arid1a in wildtype, Arid1afl/fl and Arid1afl/wt mice. (d) Kaplan–Meier tumor-free curve of Arid1a in wildtype (n = 142), Arid1afl/fl (n = 41), and Arid1afl/wt (n = 22), mice (p-value < 0.0001). Black lines represent all the mice that were censored (no tumor). (e) Gross necropsy showing the common sites of primary and metastasized tumor formation in Arid1afl/fl and Arid1afl/wt mice (P = Primary, M = Metastatic tumors). (f) Micro-CT image showing the formation of multiple tumors (yellow arrows) on Arid1afl/fl mice at various ages—(top) Arid1a wildtype control, (middle) Arid1afl/fl mice at 217 days, (bottom) Arid1afl/fl mice at 91 days.

