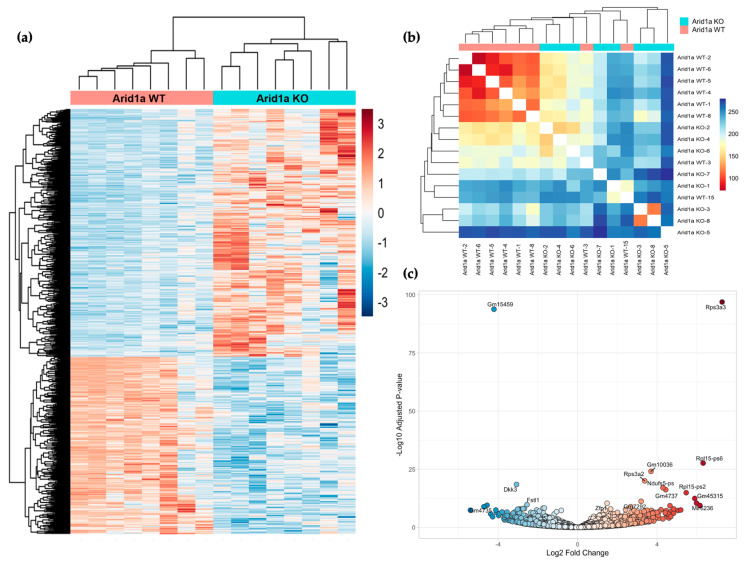
Figure 3.
Transcriptional comparison of Arid1a WT and Arid1a KO osteosarcomas. (a) Heatmap demonstrating the distribution of top 1000 significant differentially expressed genes (clustered by Z-scores) between Arid1a WT (Red) and Arid1a KO (Blue) mouse osteosarcomas. (b) Euclidean distance between samples. (c) Volcano plot representing most significant DE genes in both cohorts, X-axis representing log2 FC and Y-axis presenting the –log10 of the adjusted p-value.

