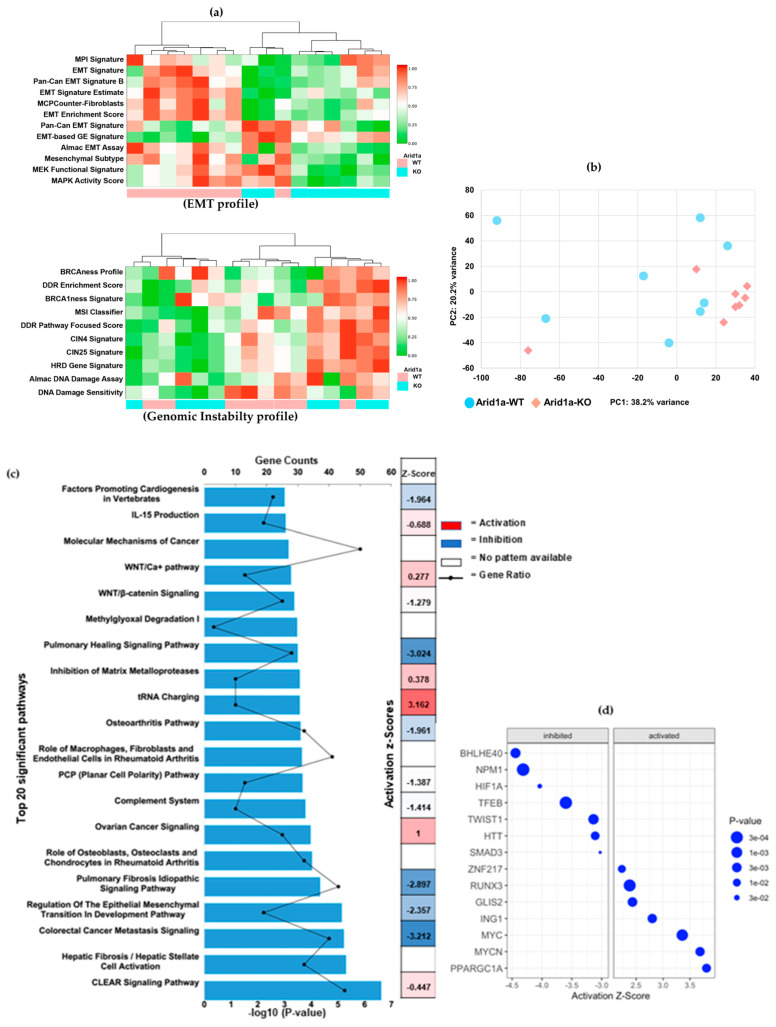
Figure 4.
Molecular pathway analysis. (a) mRNA profiling by Almac categorized the differential expression profile based on the hallmarks of cancers. Heatmaps showing the topmost significantly correlated hallmarks, (top) EMT pathways and (bottom) genomic instability. Samples represented by columns and RNA expression signatures represented in rows. Each colored square indicates the expression of the multi-gene signature for that sample (Red = increased expression levels or activation of the hallmark, green = decreased expression levels or repression of the hallmark). (b) Principal Component Analysis of the gene expression data. (c) IPA analysis showing the top 20 significant signaling pathways correlating the differentially expressed genes between Arid1a WT and KO osteosarcomas (p-value < 0.05). X-axis representing the −log10 p-value. (d) IPA upstream regulator analysis based on activation Z-score and p-values.

