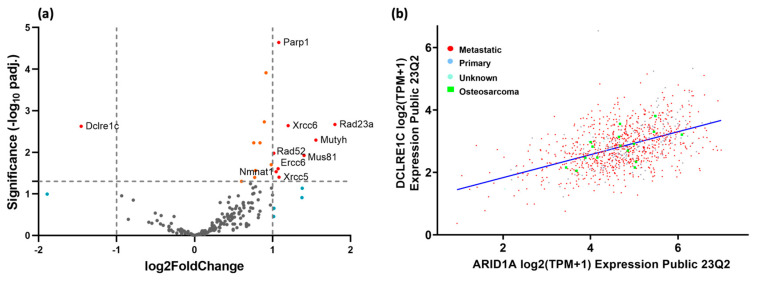
Figure 5.
Impact of Arid1a loss on DNA damage repair pathways. (a) Volcano plot displaying the most significant differentially regulated genes involved in DNA repair pathways between Arid1a KO and WT mouse OS; the X-axis represents log2 fold change (thresholds of −1 and 1) and the Y-axis shows the adjusted −log10 p-values (threshold 0.05). (b) Correlation between DCLRE1C/Artemis and Arid1a expression in all human cancer cell lines (n = 1450) and in OS cell lines (n = 16) from the CCLE database (R2 = 0.435, p-value = 4.3 × 10−68 and R2 = 0.581, p-value = 0.0183, respectively).

