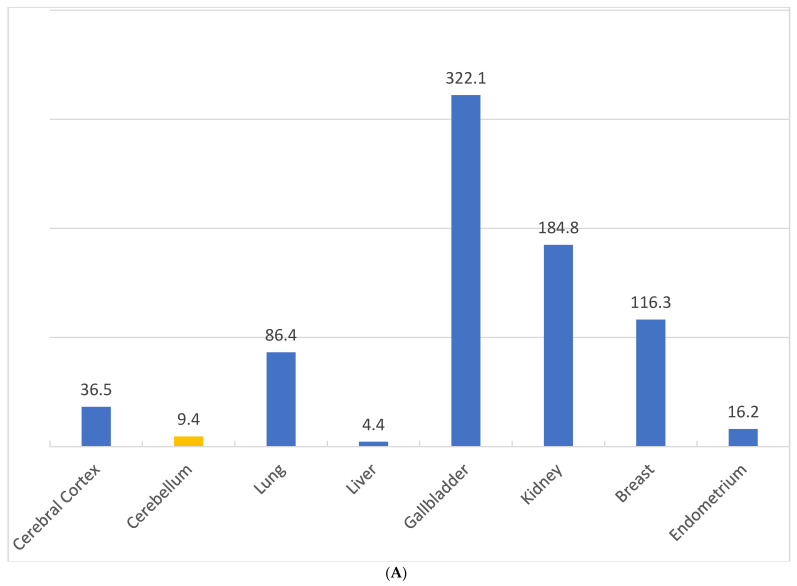
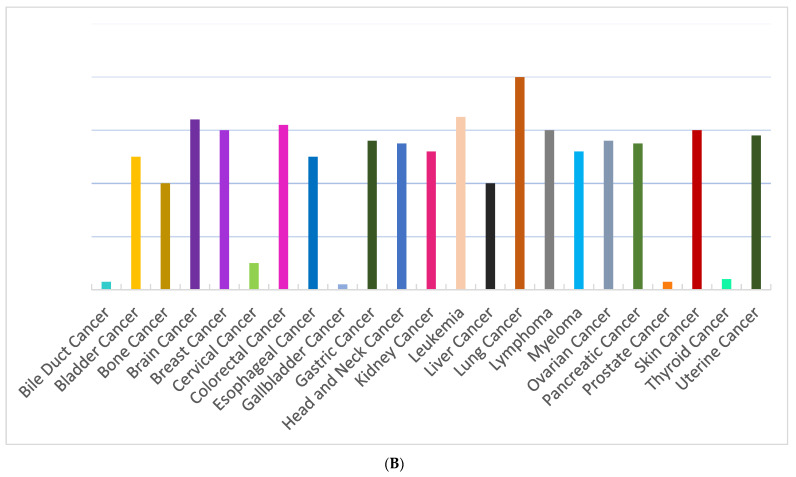
Figure 4.
(A). NQO1 FANTOM Tag expression as reported in different human tissues. The tissue data for RNA expression obtained through a Cap Analysis of Gene Expression (CAGE) generated by the FANTOM5 project are shown. The values represent scaled Tags Per Million (data adapted from https://www.proteinatlas.org/ENSG00000181019-NQO1/tissue, accessed on 27 July 2024). (B). Relative NQO1 protein expression in different human cancer types. Most cancers display strong cytoplasmic positivity in a fraction of cells, greater in lung cancer, followed by colorectal, endometrial, stomach, and pancreatic cancers (Data adapted from https://www.proteinatlas.org/ENSG00000181019-NQO1, accessed on 24 July 2024).


