Figure 5.
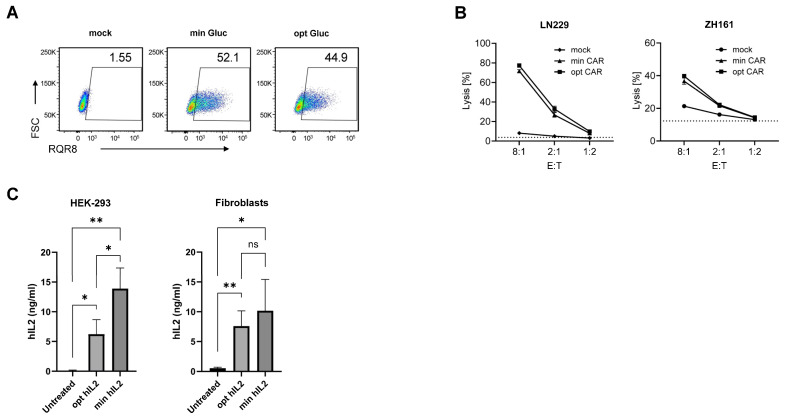
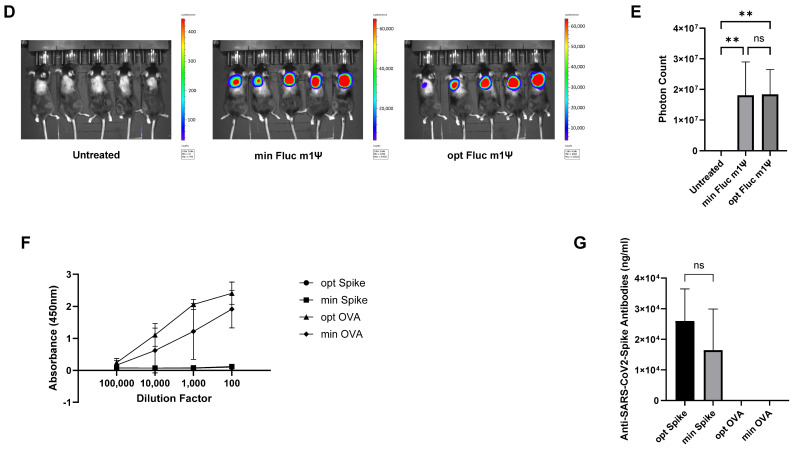
minRNA design coding for therapeutic proteins. (A,B) Human T cells were mock transfected or transfected with min or opt mRNA coding for NKG2D-CAR-T2A-RQR8. (A) Flow cytometry analysis for RQR8 surface expression 24 h after transfection. RQR8-positive cells were detected using anti-CD34-PE antibody (RQR8; PE: phycoerythrin) and forward scatter (FSC). (B) Flow cytometry quantifications of glioma cells surface-stained with PKH26 and incubated for 24 h with human T cells at different E:T ratios. Tumor cell viability was assessed using Zombie Violet and cell lysis was determined as the percentage of death in the population of labeled tumor cells. Unspecific background lysis is represented by dotted lines. (C) minRNA and optimized mRNA coding human IL-2 were transfected into HEK-293 or human primary fibroblasts. Supernatants were measured 96 h later for IL-2 production by ELISA. Experiments were performed in triplicate and data presented as the mean ± SD. An unpaired, two-tailed Student’s t-test was used to determine the significance between the different groups. ns = not significant, * p < 0.05, ** p <0.01. (D) Representative IVIS images of mice untreated or injected subcutaneously with mRNA coding for firefly luciferase with either the opt or min mRNA design. Regions of interest were quantified for average luminescence (counts) (IVIS Living Image 4.0) (E) Quantification of the photon flux shown in (D). (F,G) ELISA quantification of serum antibodies against ovalbumin or spike in mice injected subcutaneously with LNP containing min or opt mRNA coding ovalbumin or spike. (E–G) N = 5 mice per group. Data are presented as the mean ± SD. (E) One-way ANOVA with Tukey’s multiple comparison test or (G) an unpaired, two-tailed Student’s t-test was used to determine the significance between the different groups. ns = not significant, ** p < 0.01.


