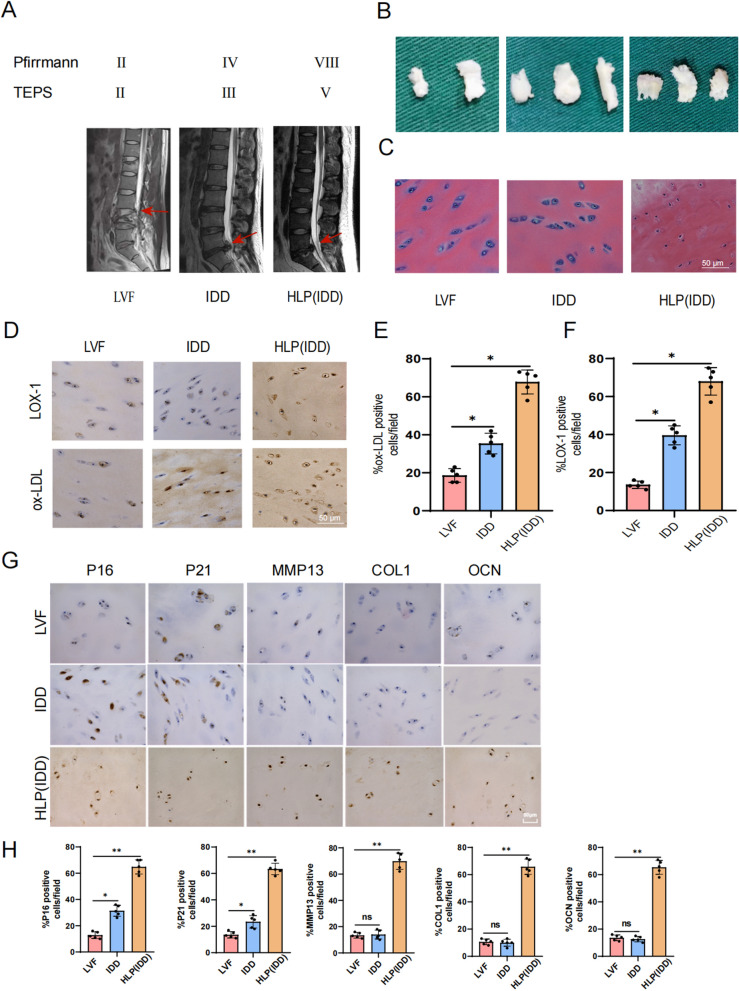
Fig. 1.
The expression of ox-LDL and LOX-1 in degenerative cartilage endplate tissues. A MRI was used to examine human intervertebral disc, with T2-weighted signal, and representative MRI images were displayed. Each group consisted of 5 samples, with the corresponding intervertebral disc indicated by red arrows. B General organization of human cartilage end plates. C H&E staining of human CEP tissues. Scale bar = 50 μm. D Immunohistochemical staining of ox-LDL, LOX-1 in CEP tissues. Scale bar = 50 μm. E, F Quantitative analysis of ox-LDL, LOX-1 expression in human CEP tissues. G Immunohistochemical staining of cell senescence and calcification markers P16, P21, MMP13, COL1, OCN in human CEP tissues. Scale bar = 50 μm. H Quantitative analysis of P16, P21, MMP13, COL1, OCN expression in human CEP tissues. Each image represented a sample from a total of 5 examined samples, Scale bar = 500 μm. Compared to LVF group, *p < 0.05, **p < 0.01, ns indicated non-significance difference

