Fig. 4.
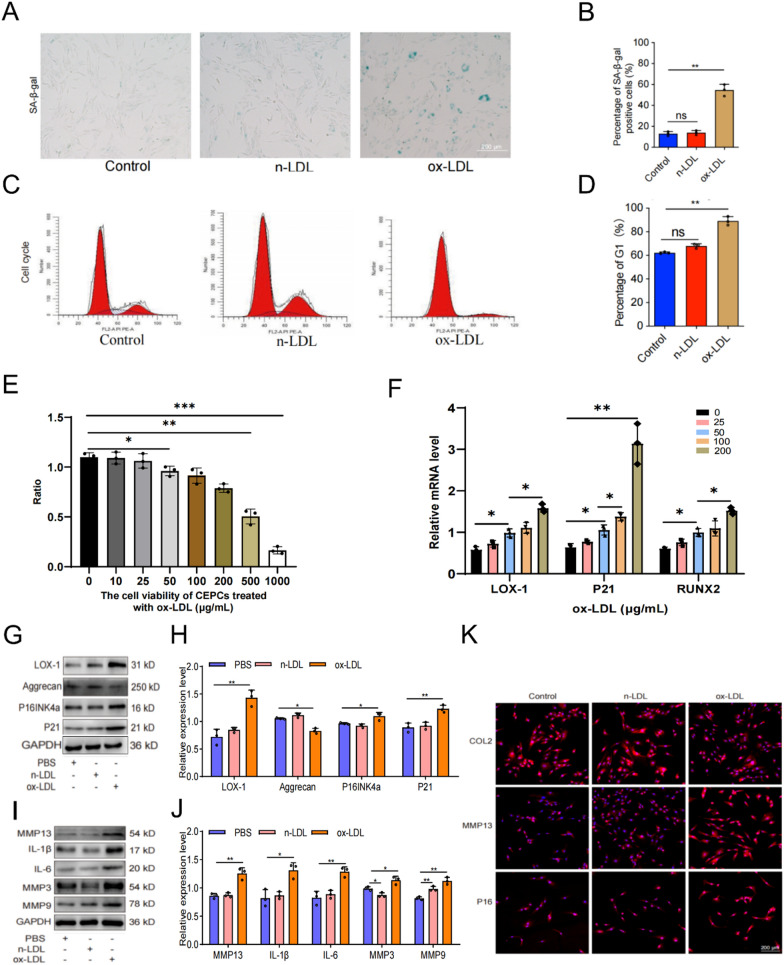
Ox-LDL induced endplate chondrocytes senescence. A, B Results of SA-β-Gal staining results and quantitative analysis (scale = 200 μm). C, D Cell cycle detection and analysis results. E The effects of different concentrations of ox-LDL on the cell viability of endplate chondrocytes. (F) The effects of various concentrations ox-LDL on mRNA expression levels of LOX-1, P21 and RUNX2. G-J Western blotting and quantitative analysis of senescence-related proteins. K COL2, MMP13, P16 representative immunofluorescence staining results. Compared to control group, **p < 0.01, ns indicated non-significance difference; Compared to 0 μg/mL group, *p < 0.05, **p < 0.01, ***p < 0.001; Compared to PBS group, *p < 0.05, **p < 0.01

