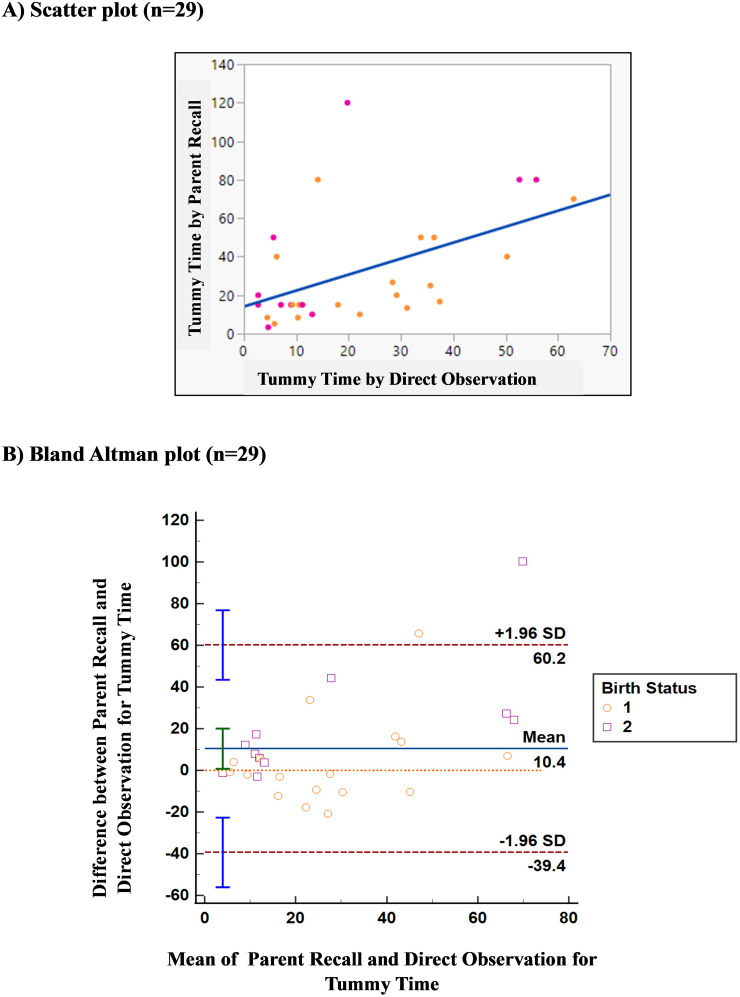
Figure 2.
Scatterplot and Bland–Altman plot of parent recall for tummy time plotted against direct observation for all infants (n = 29). (A) Duration of parent-reported tummy time (y-axis) versus directly observed tummy time (x-axis) in minutes. The identity line is indicated in blue (ρ = .54, p = .002), full-term infants are indicated in orange, and preterm infants are indicated in pink. (B) Difference between the two approaches (y-axis) versus mean of the two approaches (x-axis).
Note. Solid blue line = systematic bias between the two approaches. Dashed orange line indicates the zero line, where the two measurement approaches have no differences. If the blue line is located above the orange line, then we can conclude that the parents overestimated tummy time recall compared with direct observation, and vice versa. Dashed red lines indicate the upper and lower 95% limits of agreement, computed as the mean difference (bias) plus or minus 1.96 times its SD.

