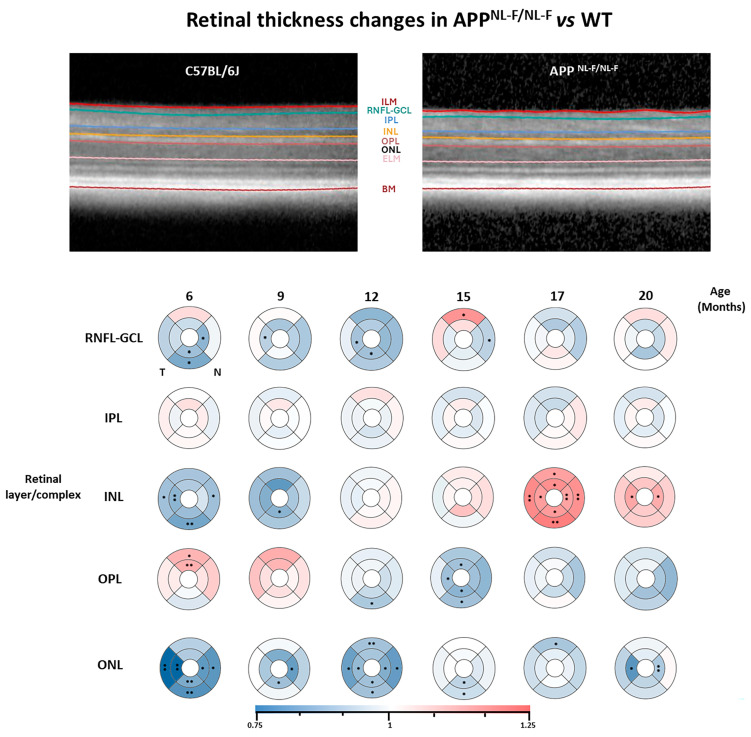
Figure 3.
Representative images of the SD-OCT analysis and colorimetric representation of the retinal layers’ thickness differences in each study group between the APPNL-F/NL-F and WT groups. At each study time and in each group, n = 6. (RNFL-GCL: retinal nerve fiber layer and ganglion cell layer complex; IPL: inner plexiform layer; INL: inner nuclear layer; OPL: outer plexiform layer; and ONL: outer nuclear layer. ETDRS rings of 1-, 2-, and 3-mm diameters.) Blue tones: thinning; red tones: thickening. Significance values were set to • p < 0.05 and •• p < 0.01.

