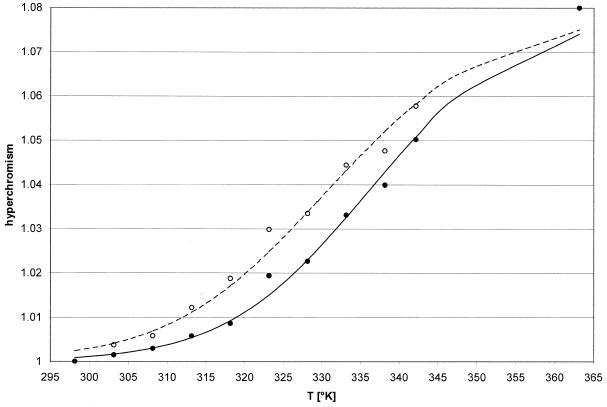
Figure 5.
Hyperchromism curves of the MB and S40 sequences. The MB and S40 oligonucleotides were dissolved in reaction buffer at a concentration of 1 OD (260 nm) in heated 100 µl quartz cuvettes. Temperature was increased in 5 K steps and the absorbance at 260 nm recorded. MB, filled circle; S40, open circle.

