Figure 6.
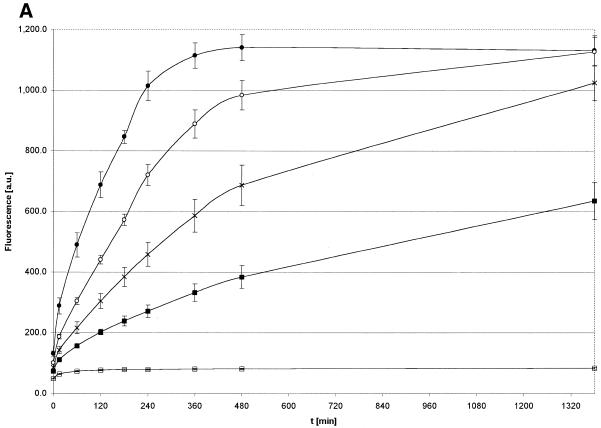
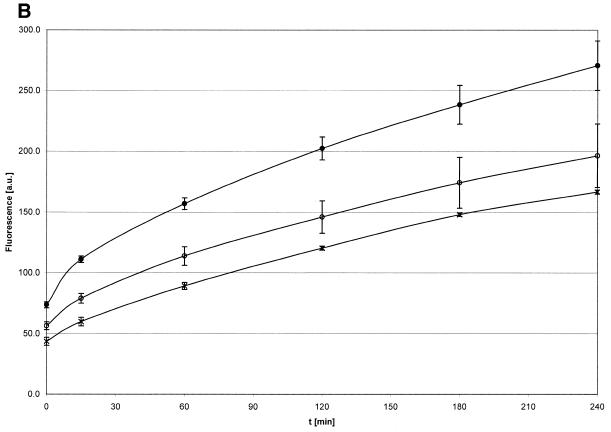
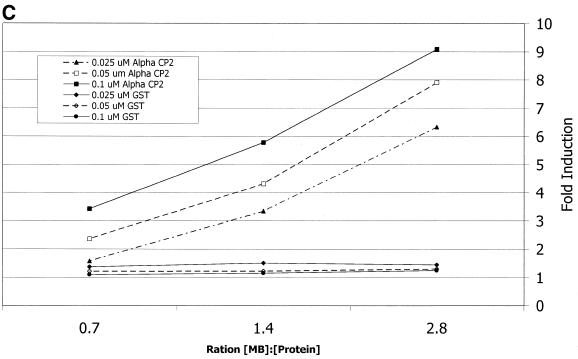
Kinetics of the αCP2–MB interaction. The kinetics of the fluorescent reaction at 37°C at constant concentrations of either molecular beacon (A) or αCP2 (B). (A) Molecular beacon (0.1 µM) and different concentrations of αCP2 (filled circle, 0.56 µM; open circle, 0.28 µM; cross, 0.14 µM; filled box, 0.07 µM; open box, 0 µM). The reaction was slow, with maximum fluorescence reached after ∼20 h. (B) αCP2 (0.07 µM) and different concentrations of molecular beacon (filled circle, 0.1 µM; open circle, 0.05 µM; cross, 0.025 µM). (C) GST and αCP2 were used with a constant MB concentration to assess non-specific protein–MB interactions. There was no increase with GST alone, indicating that the fluorescence is due to a specific interaction between αCP2 and the MB sequence. The concentration of MB is noted in the figure; the data points were all taken at 480 min, under the conditions described in Materials and Methods.


