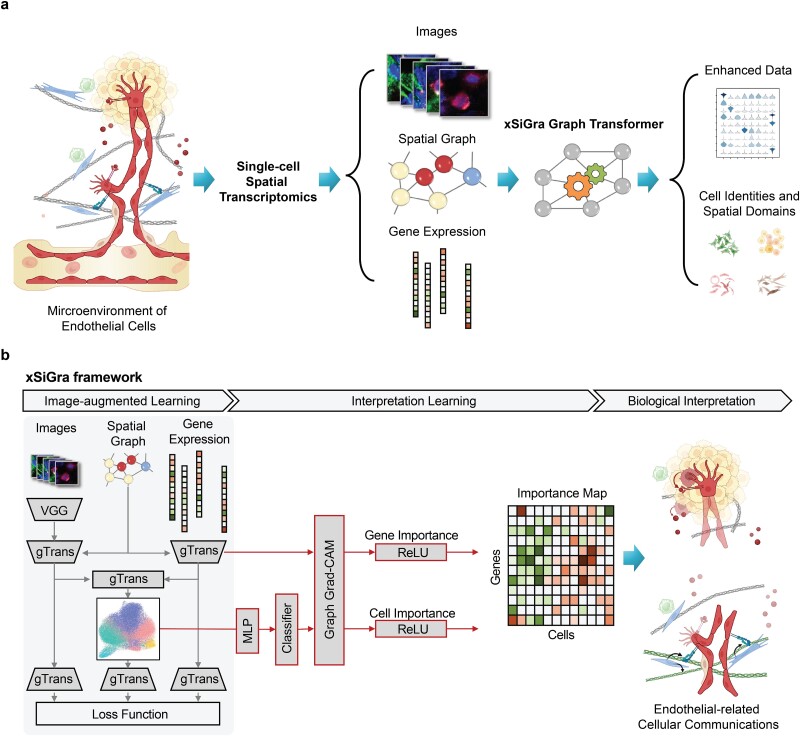
Figure 1.
Overview of xSiGra model. (a) xSiGra uses spatial transcriptomics data to gain insights about the cellular microenvironment. Spatial transcriptomics profiles are represented by graph structure with each cell in spatial graph having associated gene expression and multichannel images. xSiGra generates enhanced gene expressions and identifies spatial cell types, with related interpretable features for biological insights. (b) xSiGra performs image augmented learning to enhance transcriptomics data (SiGra+) and recognize spatial cell types. It also provides interpretable features that can be used for biological interpretation.

