
Figure 1: Pancreatic stellate cells contribute to the stromal microenvironment throughout tumorigenesis.
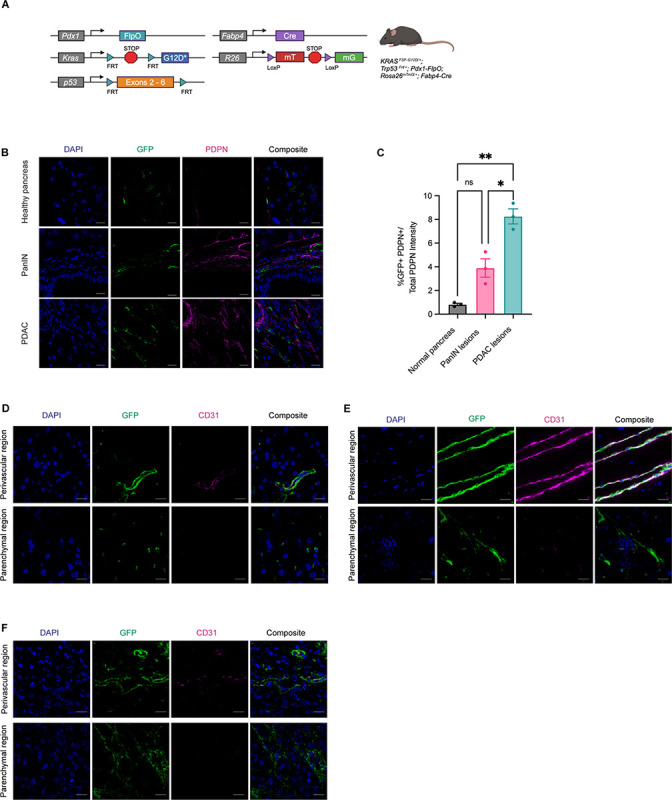
A, Genetic schema of KrasFSF-G12D/+;Trp53FRT/+;Pdx1-FlpO;Rosa26mTmG/+;Fabp4-Cre murine model. B, Representative images of IHC staining for GFP (green) and Podoplanin (PDPN, magenta) among normal pancreas, PanIN lesions, and mPDAC lesions. Scale bar, 10 μm. C, IHC staining quantification of percent GFP+PDPN+ (double-positive) cells over total PDPN+ expression among the 3 disease states in B (n = 3). D, Representative images of IHC staining for GFP (green) and CD31 (magenta) within normal pancreas (n = 5). Scale bar, 10 μm. E, Representative images of IHC staining for GFP (green) and CD31 (magenta) within GEMM pancreata (n = 3). Scale bar, 20 μm. F, Representative images of IHC staining for GFP (green) and CD31 (magenta) within pancreata of KPC-derived orthotopically implanted PDAC in Rosa26mTmG/+;Fabp4-Cre mice (n = 3). Scale bar, 10 μm.