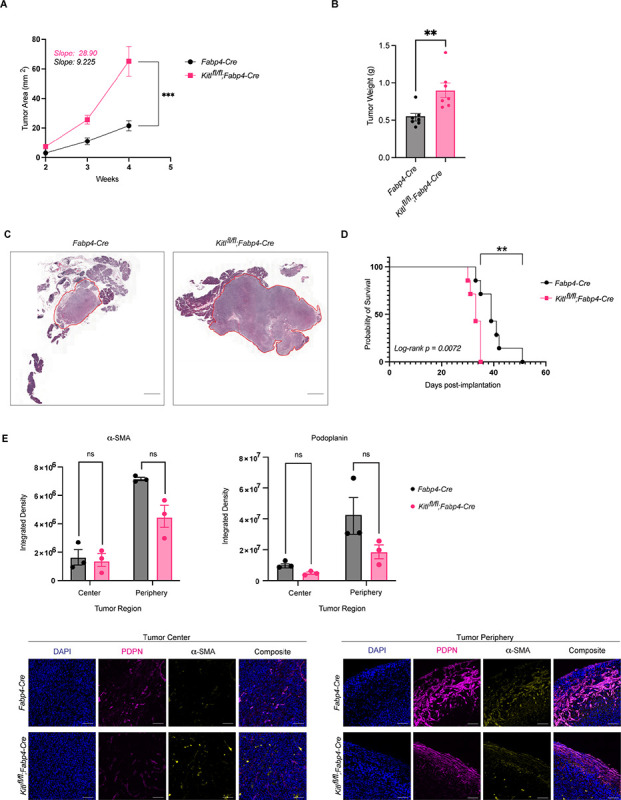
Figure 4: Mesenchymal KITL restrains pancreatic tumor growth.

A, Average tumor area (mm2) between Fabp4-Cre control and Kitlfl/fl;Fabp4-Cre mice, injected with KPC-derived murine PDAC cells 6419c5 (n = 7 mice per arm). Data are represented as mean ± SEM. Slopes tabulated via simple linear regression analysis. B, Tumor weights (g) at experimental endpoint between Fabp4-Cre control and Kitlfl/fl;Fabp4-Cre mice, injected with KPC-derived murine PDAC cells 6419c5 (n = 7 mice per arm). Data are represented as mean ± SEM. C, Representative H&E images of Fabp4-Cre control and Kitlfl/fl;Fabp4-Cre mice injected with KPC-derived murine PDAC cells 6419c5, at the same experimental endpoint. Scale bar, 1mm. D, Kaplan–Meier plot depicting percent probability of survival between Fabp4-Cre control and Kitlfl/fl;Fabp4-Cre mice, injected with KPC-derived murine PDAC cells 6419c5 (n = 7 mice per arm). Log-rank p value = 0.0072. E, Representative images of IHC staining (bottom) and quantification (top) of aSMA and podoplanin (PDPN) between Fabp4-Cre control mice and Kitlfl/fl;Fabp4-Cre mice, injected with KPC-derived murine PDAC cells 6419c5 (n = 3 mice per arm). Data are represented as mean ± SEM. *, P < 0.0332; **, P < 0.0021; ***, P < 0.0002; ****, P < 0.0001 Mann-Whitney unpaired t test; ns, not significant.
