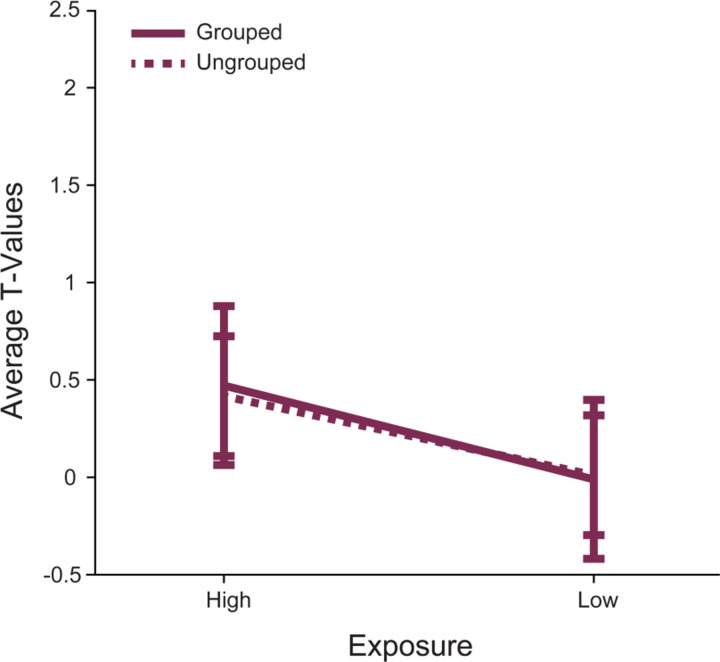
Figure 2. Right area p46f does not respond differently to Low Exposure versus High Exposure images.
The mean T-values for each condition > baseline are shown. The error bars represent the 95% confidence intervals (1.96 × standard error of the mean). Responses to stimuli in the Grouped task are shown in a solid line, while responses in the Ungrouped task are shown with a dashed line. Responses to High and Low Exposure stimuli were different such that there was a marginal main effect of stimulus exposure.

