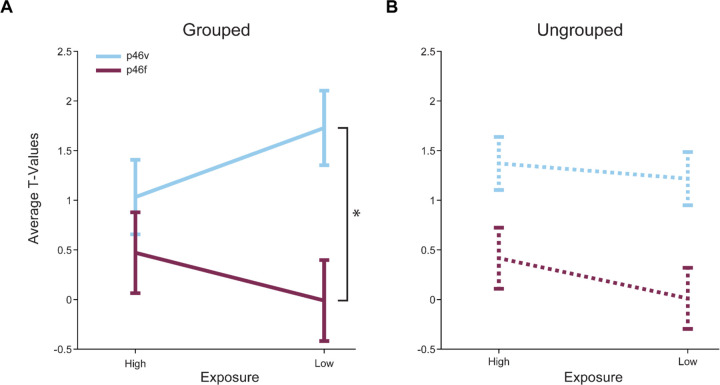
Figure 3. Right areas p46v and p46f respond differently across conditions in both tasks.
The mean T-values for each condition > baseline are shown. The error bars represent the 95% confidence intervals (1.96 × standard error of the within-bin mean). Responses in p46v are shown in blue and p46f is shown in purple. A. High Exposure compared to Low Exposure images in the Grouped task show a significant interaction effect with ROI (indicated by asterisk, p = 0.05) and a highly significant main effect of ROI. B. High Exposure compared to Low Exposure images in the Ungrouped task show a significant main effect of ROI and a marginal main effect of exposure.

