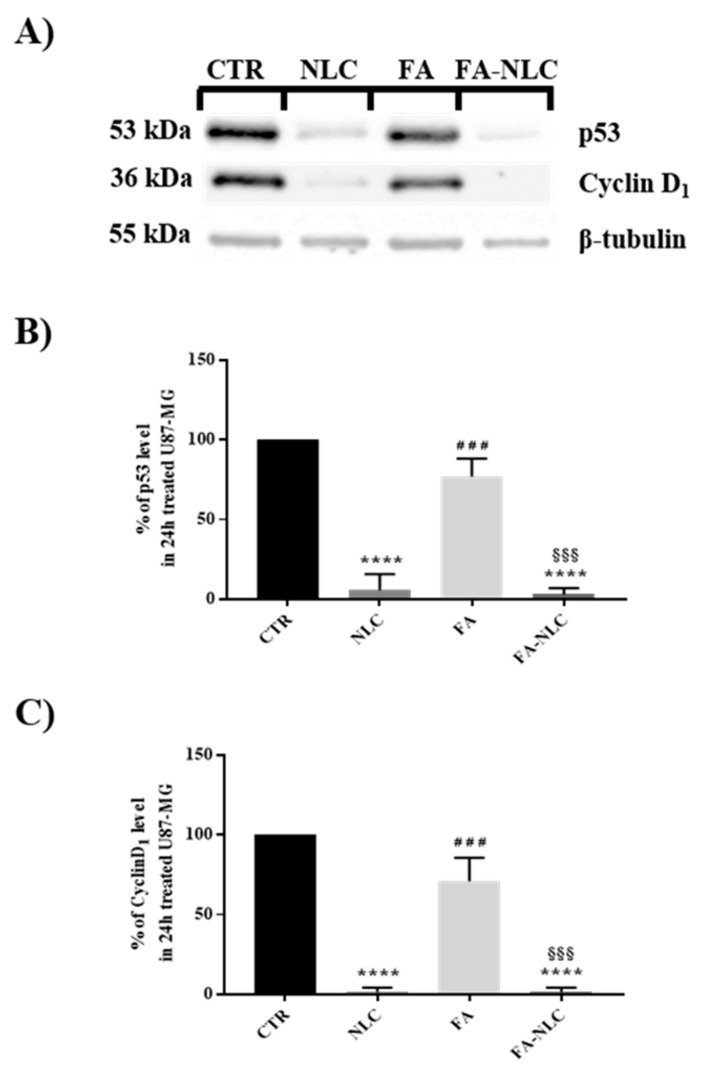
Figure 7.
Analysis of p53 and cyclin-D1 expression levels in U87-MG after 24 h treatment with blank NLCs, free FA, and FA-NLCs. (A) Western blotting analyses showing changes in p53 and cyclin D1. β-Tubulin was used as a housekeeping protein; (B) Histogram representing the percentage of expression levels of p53; results are expressed as the mean ± S.D. of the values of four separated experiments performed in triplicate. **** p < 0.0001 significant vs. control; ### p = 0.0003 significant vs. NLC, §§§ p = 0.0002 significant vs. FA. (C) Histogram representing the percentage of expression levels of cyclin D1 at the different experimental conditions. Results are expressed as the mean ± S.D. of the values of n = 4 separated experiments performed in triplicate. Statistical analysis is evaluated through one-way ANOVA test. **** p < 0.0001 significant vs. control, ### p = 0.0001 significant vs. NLCs, §§§ p = 0.0001 significant vs. FA.

