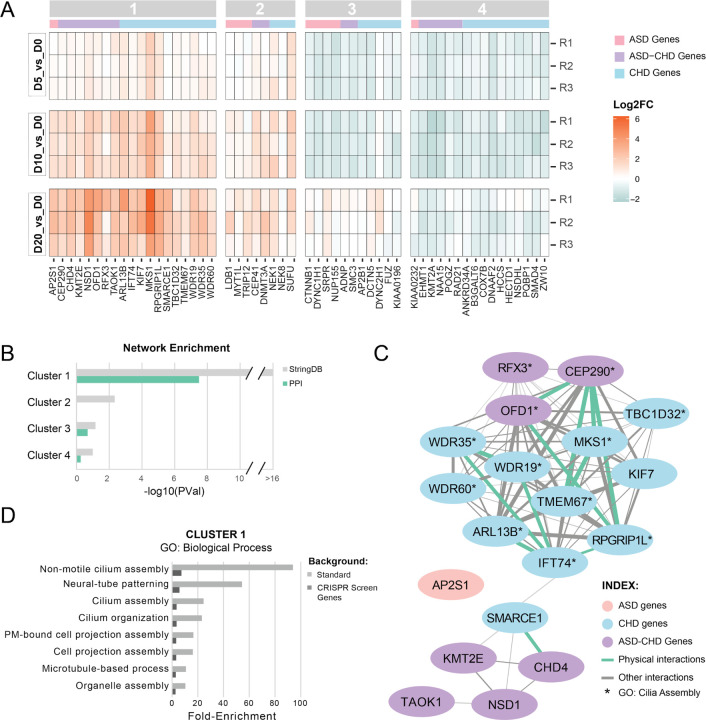
Figure 2. A subset of ASD and CHD genes converge on cilia biology.
(A) Heat-map showing gene knock-downs grouped by k-means clustering (see Figure S1). R1–3 represent biological replicates. Cutoff for genes: p-value < 0.05, absolute value of log2(fold-change) ≥ 0.585 for at least one time point. ASD genes are denoted with a pink bar, CHD genes with a blue bar, and ASD-CHD genes with a purple bar., (B) Genes within K-means cluster 1 are more connected than expected by chance based on interactions from StringDB. Enrichment for clusters 1–4 was calculated for the all interactions inStringDB (gray) and for just the physical interactions in StringDB (green). P-values are not corrected for multiple comparisons. (C) Visualization of the network of cluster 1 genes, built from the interactions cataloged in StringDB. ASD genes are in pink, CHD genes are in blue, and ASD-CHD genes are in purple. Interactions are represented by a green line (physical interactions) or gray line (Other StringDB interaction categories). (D) ToppGene GO enrichment analysis (Biological Process) of genes from cluster 1 shows enrichment of ciliary pathways, for both the standard background (light gray) and a custom background consisting of the 361 genes screened here (dark gray). Only terms with a false discovery rate less than 0.05 (Benjamini-Hochberg procedure) on both backgrounds are displayed. See also Figures S1-S2, Tables S2-S3.

