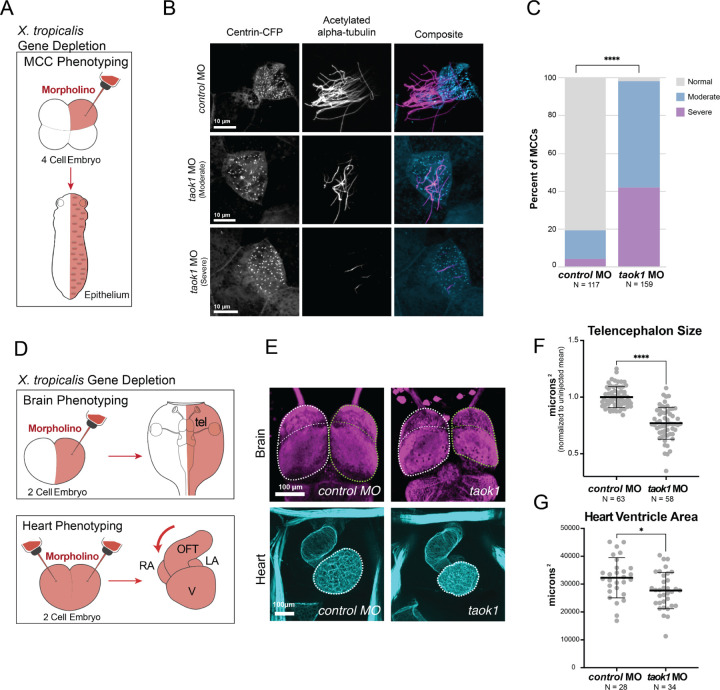
Figure 4. TAOK1 is required for brain and heart development in vivo.
(A) Depletion strategy. Morpholino and a tracer (Centrin-CFP) are injected at the four-cell stage for phenotyping of epithelial multiciliated cells (MCCs) in Xenopus tropicalis. (B) Stage 26 X. tropicalis MCCs expressing Centrin-CFP are stained for acetylated α-Tubulin (cilia, magenta). Injection of taok1 morpholino causes moderate to severe loss in cilia relative to injected non-targeting control. (C) Quantification of cilia phenotype in MCCs by condition. Y-axis shows percent of cilia classified as normal (≥50 cilia, grey), moderate (10–50 cilia, blue), or severe (<10 cilia, purple). *N = X cells across 3 embryos. Significance was calculated using Chi-squared test (****p < 0.00001) (D) Depletion strategy (Rosenthal et al. 2022). Morpholino and a tracer (dextran) are injected at the two-cell stage, either into one cell (brain phenotyping) or both (heart phenotyping). Stage 46 X. tropicalis tadpoles are phenotyped for brain (top) anatomy by comparing bilateral symmetry. The tadpoles are phenotyped for heart (bottom) by comparing heart looping direction and ventricle size. Annotations: telencephalon (tel), outflow tract (oft), ventricle (V), right atrium (RA), and left atrium (LA). (E) Images of brain/telencephalon (top, β-tubulin, magenta) and heart (bottom, phalloidin/actin, cyan). Negative control standard morpholino is on the left and taok1 morpholino is on the right. Brain: Disruption of taok1 results in decreased telencephalon size (green dotted outline) relative to control. Heart: Loss of taok1 results in decreased ventricle size relative to the control. Scale bars: 100 μm. (F) Telencephalon size variance for taok1 depletion. Variation in forebrain size relative to the uninjected side (μm^2) for control morpholino-injected animals versus taok1 depleted animals. Significance was calculated using a Mann-Whitney rank sum test (****p < 0.0001). (G) Ventricle size variance for taok1 depletion. Variation in ventricle size for taok1-depleted embryos versus control injected embryos. Significance was calculated using non-parametric Mann-Whitney rank sum test (*p < 0.05). See also Figure S5.

