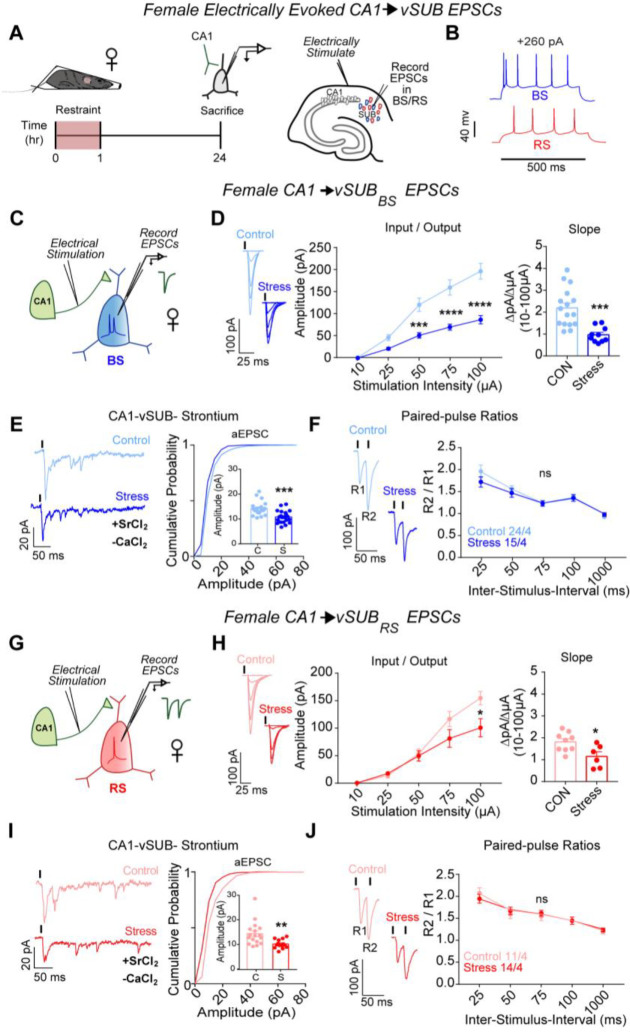
Figure 1. ARS weakens CA1-vSUB basal excitatory synaptic strength in females.
(A) Electrically evoked EPSCs from CA1 were recorded in vSUB neurons 24-hr after stress. (B) Representative traces of action potential firing patterns in BS (blue) or RS (red) cells. (C,G) Electrically stimulated EPSCs were recorded in BS or RS cells. (D) Input-output representative traces (left), summary graph (middle), and slope (right) for EPSCs recorded in BS (10 μA, P>0.9999; 25 μA, P=0.5756; 50 μA, ***P=0.0007; 75 μA, ****P<0.0001; 100 μA, ****P<0.0001; slope, ***P=0.0003; control N=16/4, stress N=10/4) or (H) RS cells (10 μA, P>0.9999; 25 μA, P=0.9996; 50 μA, P=0.9996, 75 μA, P=0.0828; 100 μA, *P=0.0022; slope, P=0.0189; control n=9/3, stress n=6/4). (E,I) Representative traces of strontium-mediated aEPSCs after electrical stimulation (left) and aEPSC amplitude (right) for BS (E; ***P= 0.0002; control n=20/3, stress n=21/3) or RS cells (I; *P=0.043; control n=17/3, stress n=14/3). (F,J) Representative PPR trace (50ms) (left) and PPR measurements (right) from BS (F; 25-ms ISI, P=0.2461; 50-ms ISI, P= 0.9573; 75-ms ISI, P>0.9999; 100-ms ISI, P>0.9999; 1000-ms ISI, P=0.9959; control n=24/4, stress n=15/3) or RS cells (J; 25-ms ISI, P=0.8008; 50-ms ISI, P=0.9785; 75-ms ISI, P=0.9827; 100-ms ISI, P>0.9999; 1000-ms ISI, P=0.9990; control n=11/4, stress n=14/4). Data are represented as mean +/− SEM; means were calculated from the total number of cells. Numbers in the legend represent the numbers of cells/animals. Statistical significance was determined by a 2-way ANOVA or unpaired t-test. See also Figure S1.

