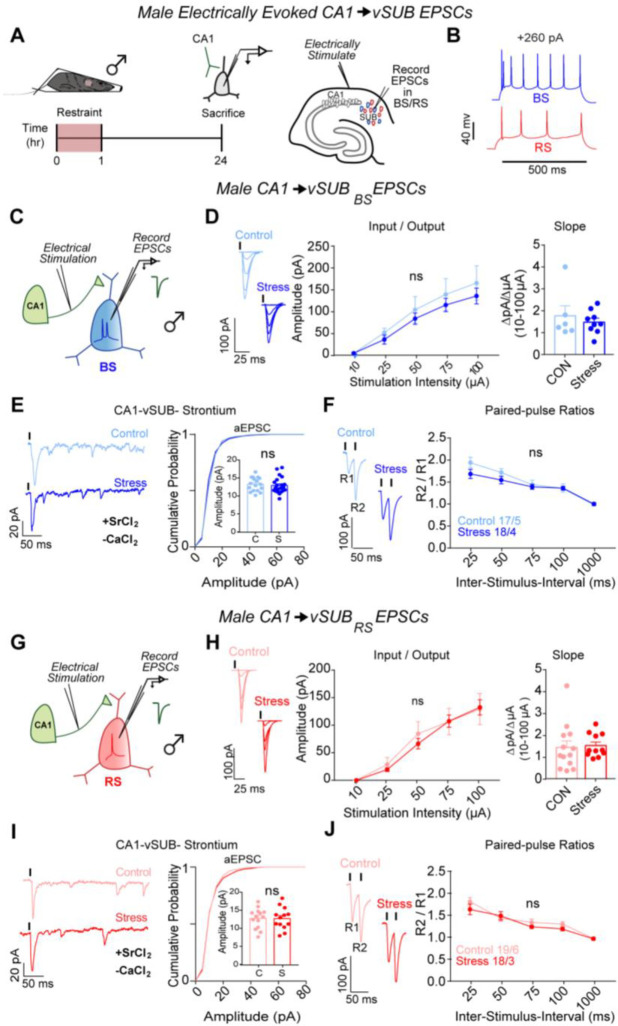
Figure 2. ARS does not alter CA1-vSUB basal excitatory synaptic strength in males.
(A) Electrically evoked EPSCs from CA1 were recorded in vSUB neurons 24hr after stress. (B) Representative traces of firing patterns in BS or RS cells. (C,G) Electrically stimulated EPSCs were recorded in BS or RS cells. (D) Input-output representative traces (left), summary graph (middle), and slope (right) for EPSCs recorded in BS (D; 10 μA, P>0.9999; 25 μA, P=0.9933; 50 μA, P=0.9887; 75 μA, P=0.9863; 100 μA, P=0.9701; slope, P=0.7043; control n=6/3, stress n=8/3) or (H) RS cells (10 μA, P>0.9999; 25 μA, P=0.9976; 50 μA, P=0.9484, 75 μA, P>0.9999; 100 μA, P>0.9999; slope, P=0.8081; control n=13/3, stress n=11/4). (E,I) Representative traces of strontium-mediated aEPSCs after electrical stimulation (left) and aEPSC amplitude (right) for BS (E; P= 0.6312; control n=23/3, stress n=14/3) or RS cells (I; P=0.9679; control n=19/3, stress n=21/3). (F,J) Representative PPR trace (50ms) (left) and PPR measurements (right) from BS (F; 25-ms ISI, P=0.1233; 50-ms ISI, P= 0.5243; 75-ms ISI, P=0.9957; 100-ms ISI, P>0.9999; 1000-ms ISI, P>0.9999; control n=17/5, stress n=18/4) or RS cells (J; 25-ms ISI, P=0.3803; 50-ms ISI, P= 0.9821; 75-ms ISI, P=0.8702; 100-ms ISI, P=0.8262; 1000-ms ISI, P>0.9999; control n=19/6, stress n=18/4). Data are represented as mean +/− SEM; means were calculated from the total number of cells. Numbers in the legend represent the numbers of cells/animals. Statistical significance was determined by a 2-way ANOVA or unpaired t-test. See also Figure S2.

