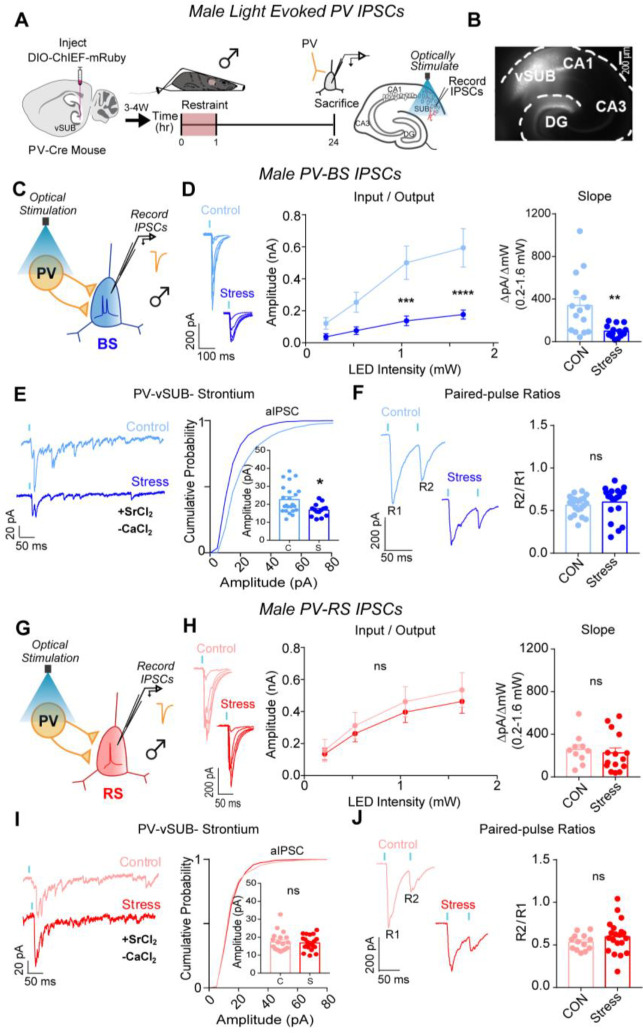
Figure 4. ARS weakens PV-vSUB-BS inhibition via decreased postsynaptic strength in males.
(A) A Cre-dependent ChIEF AAV was injected into vSUB of PV-Cre female mice and optogenetically evoked IPSCs from PV interneurons were recorded from BS or RS cells 24 hr after 1 hr of restraint stress. (B) Example image of ChIEF-mRuby expression in the vSUB. (C,G) Optogenetically stimulated EPSCs were recorded in BS or RS cells after stress. (D,H) Input-output representative traces (left), summary graph (middle), and slope (right) for IPSCs recorded in BS (D; 0.213 pA, ****P<0.0001; 0.518 pA, ****P<0.0001; 1.050 pA, **P=0.0030; 1.640 pA, ****P<0.0001; slope, **P=0.0029; control n=15/3, stress n=15/3) or RS cells (H; 0.213 pA, P=0.9992; 0.518 pA, P=0.9813; 1.050 pA, P=0.9491; 1.640 pA, P=0.9289; slope, P=0.6343; control n=10/3, stress n=15/3). (E,I) Representative traces of strontium-mediated aIPSCs after optogenetic stimulation (left) and aIPSC amplitude (right) for BS (E; **P=0.0109; control n=24/3, stress n=16/3) or RS cells (I; P=0.7594; control n=19/3, stress n=21/3). (F,J) Representative PPR traces (50ms) (left) and PPR measurements (right) from BS (F; P=0.4339; control n= 21/3, stress n= 24/3) or RS cells (J; P=0.2890; control 13/3, stress n=19/3). Data are represented as mean +/− SEM; means were calculated from the total number of cells. Numbers in the legend represent the numbers of cells/animals. Statistical significance was determined by a 2-way ANOVA or unpaired t-test. See also Figures S4, S6, S7.

