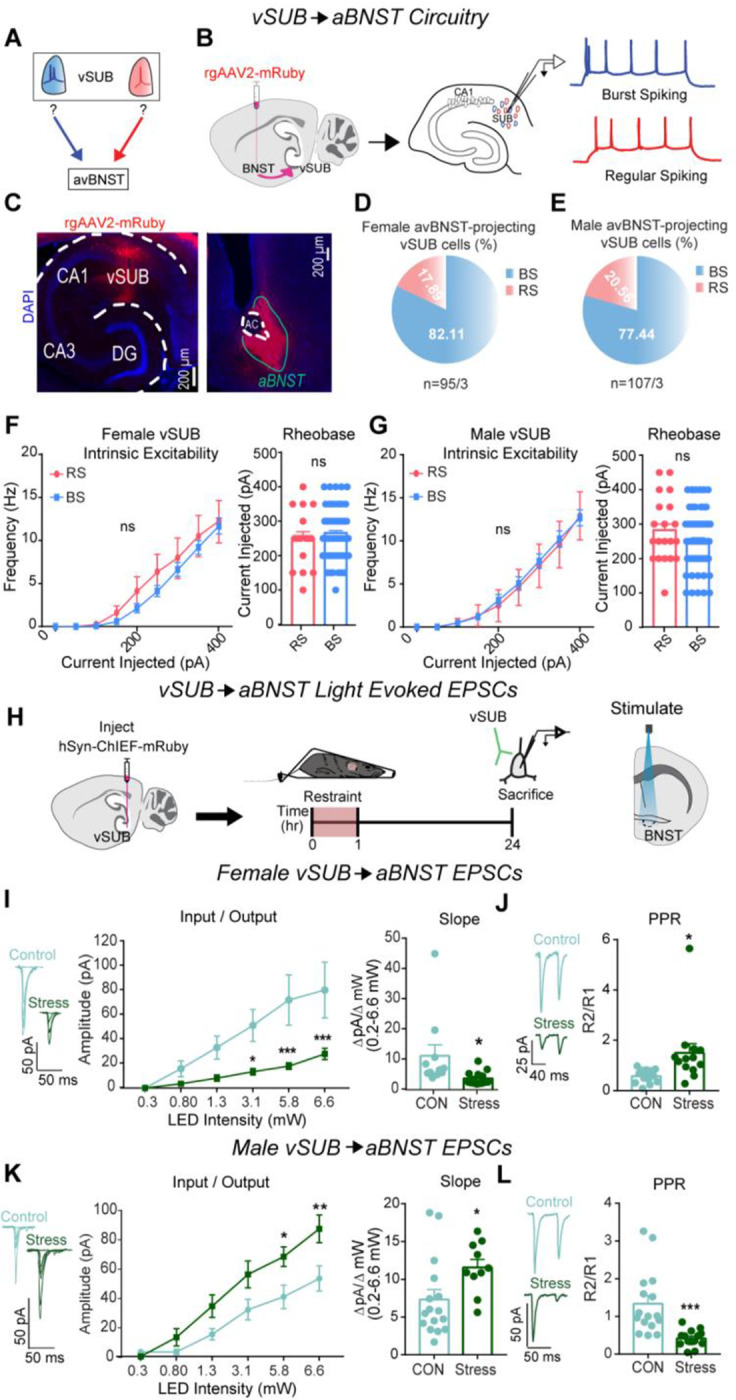
Figure 5. vSUB output to the aBNST is primarily from BS cells and stress causes sex dependent changes in vSUB-aBNST synaptic strength.

(A) Diagram depicting the unknown identity of vSUB cells that project to the aBNST. (B) Diagram of injection of rgAAV2-mRuby in the aBNST and subsequent patching of fluorescently labeled cells in the vSUB to identify cells as BS or RS. (C) Representative images of the mRuby expression in the vSUB and injection site in the aBNST. (D,E) Cellular identity of aBNST projecting cells in the vSUB of female (n=95/3) or male (n=107/3) mice. (F-G) Intrinsic excitability (left) and rheobase (right) of aBNST projecting cells in the vSUB in female (f; P=0.3398; rheobase, P=0.6624; BS=64/3 RS=16/3) or male (G; P=0.5432; rheobase, P= 0.1793; BS=72/3, RS=20/3) mice. (H) A ChIEF AAV was injected into the vSUB and optogenetically evoked EPSCs were recorded in the aBNST in male and female mice 24 hr after restraint stress. (I, K) Input-output representative traces (left), summary graph (middle), and slope (right) for EPSCs recorded in the aBNST of female (I; 0.262 pA, P>0.9999; 0.8 pA, P=0.9259; 1.29 pA, P=0.3001; 3.07 pA, *P=0.0262; 5.78 pA, ***P=0.0004; 6.61 pA, ***P=0.0006; slope, *P=0.0317; control n= 11/3, stress n=14/3) or male mice (K; 0.262 pA, P=0.9997; 0.8 pA, P=0.8669; 1.29 pA, P=0.2302; 3.07 pA, P=0.0662; 5.78 pA, *P=0.0240; 6.61 pA, **P=0.0025; slope, *P=0.0308; control n= 16/3, stress n=10/3). (J, L) Representative PPR traces (50ms) (left) and PPR measurements (right) from female (J; *P=0.0207, control n=13/3, stress n=13/3) or male (L; ***P=0.0005, control n=16/3, stress n=14/3) mice. Data are represented as mean +/− SEM; means were calculated from the total number of cells. Numbers in the legend represent the numbers of cells/animals. Statistical significance was determined by a 2-way ANOVA or unpaired t-test.
