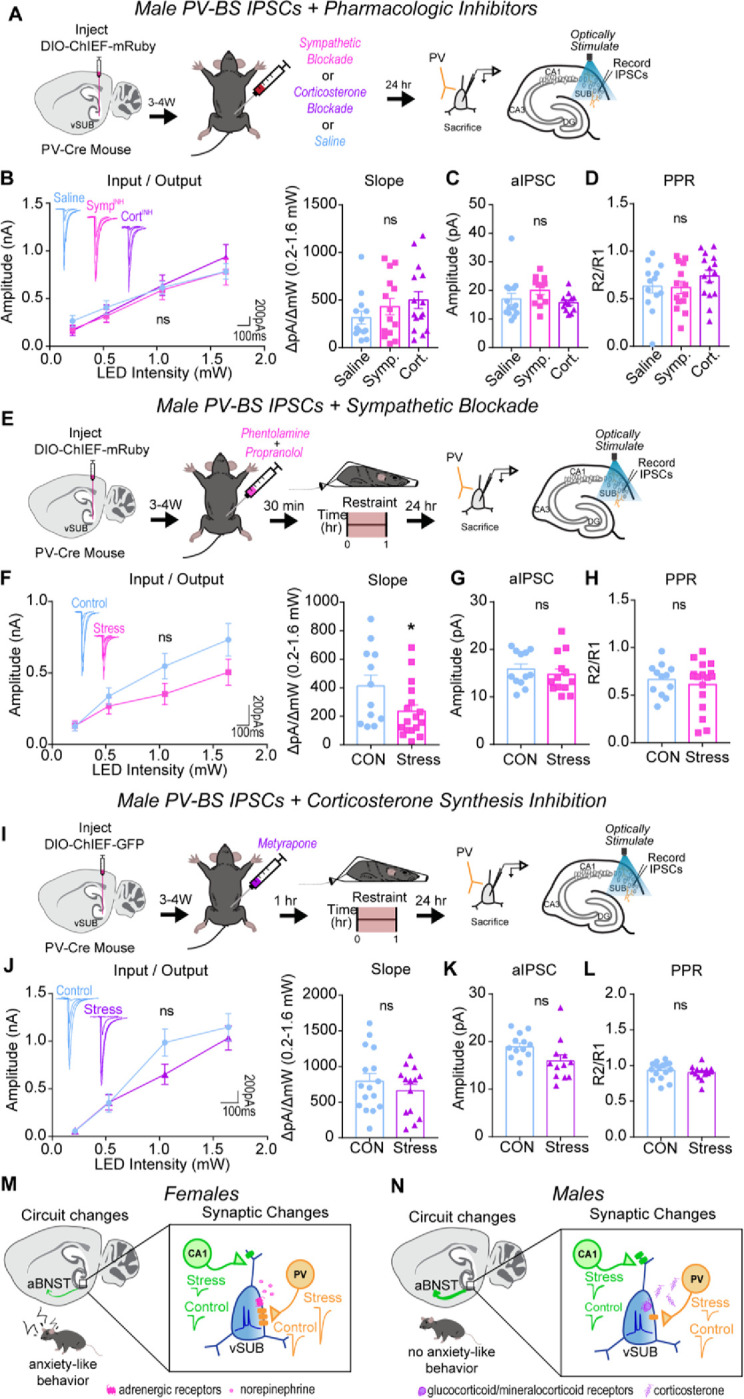
Figure 8. Systemic corticosterone signaling drives ARS-reduction of PV-BS inhibition in males.

(A) A Cre-dependent ChIEF AVV was injected into the vSUB of PV-Cre male mice and optogenetically evoked IPSCs from PV interneurons were recorded from BS cells 24-hr after saline, sympathetic block (symp), or corticosterone block (cort) pretreatment. (B) Input-output summary graph with representative traces (left) and slope (right) for IPSCs recorded in BS cells after drug controls (B; P=0.8472; slope, P=0.2972; saline n=13/3, symp n=14/3, cort n=15/3). (C) Strontium-mediated aIPSC amplitudes after optogenetic stimulation for BS cells (C; P= 0.1645; saline n=14/3, symp n=12/3, cort n=12/3). (D) PPR (50ms) measurements from BS cells (D; P=0.3462; saline n=13/3, symp n=14/3, cort n=15/3). (E,I) A Cre-dependent ChIEF AVV was injected into the vSUB of PV-Cre female mice, mice received a symp (E) or cort (I) pretreatment before ARS or underwent control conditions, and optogenetically evoked IPSCs from PV interneurons were recorded from BS cells 24-hr later. (F,J) Input-output summary graph with representative traces (left) and slope (right) for IPSCs in BS cells in symp (e; P=0.1942; slope, *P=0.0448; control n=12/3, symp=17/3) or cort (i; P=0.3476; slope, P=0.3602; control n=16/3, cort n=14/3) studies. (G,K) Strontium-mediated aIPSC amplitudes from BS cells after symp (G; P=0.4761; control n=12/3, stress n=13/4) or cort (K; P=0.0563, control n=13/3, cort n=12/3) studies. (H,L) PPR (50ms) measurements in BS cells in symp (H; P=0.5388, control n=12/3, symp n=17/3) or cort (L; P=0.4401, control n=16/3, cort n=14/3) studies. (M,N) Summary graphs of synaptic, circuit, and behavioral findings after acute stress in females (M) and males (N). Data are represented as mean +/− SEM; means were calculated from the total number of cells. Numbers in the legend represent the numbers of cells/animals. Statistical significance was determined by a 2-way ANOVA or unpaired t-test. See also Figures S10.
