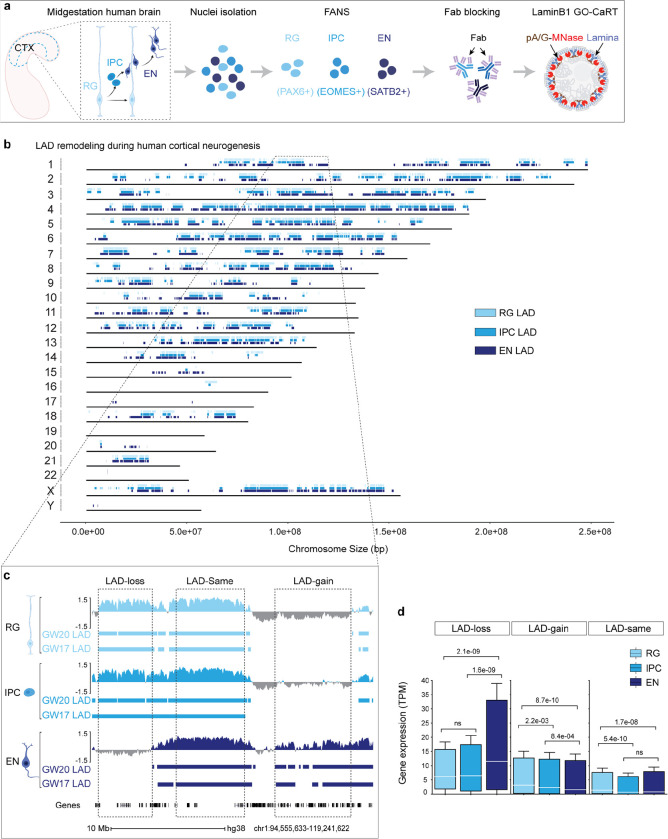
Figure 1. LAD architecture is extensively remodeled during human cortical neurogenesis.
a, Schematic of workflow for FANS-based isolation of RG, IPC and EN, Fab blocking of antibodies used in FANS and downstream LaminB1 GO-CaRT analyses. b, Distribution of LADs across all the human chromosomes at GW17 and GW20. LADs that were identified in both GW17 and GW20 samples are indicated by rectangles in light blue for RG, medium light blue for IPC and dark blue for EN. c, Representative LaminB1 GO-CaRT tracks in RG, IPC and EN at GW20. The Y-axis depicts log2 ratio of LaminB1 over IgG. LAD calls at GW20 and GW17 are depicted below tracks by rectangles. Dashed boxes show example genomic regions where LADs are lost (LAD-loss), gained (LAD-gain) or remain unchanged (LAD-same) during RG to EN differentiation. d, Box plot showing average gene expression (in transcripts per million, TPM) in LAD-loss (n = 1240), LAD-gain (n = 3241) and LAD-same regions (n = 3038) n, number of genes; P values determined by Wilcoxon rank sum test. Boxes show the range from lower quartiles (25th percentile) to upper quartiles (75th percentile), with the median line (50th percentile); whiskers extend 1.5 times the interquartile range from the bounds of the box. Related data in Extended Data Fig. 1, 2 and 3.

