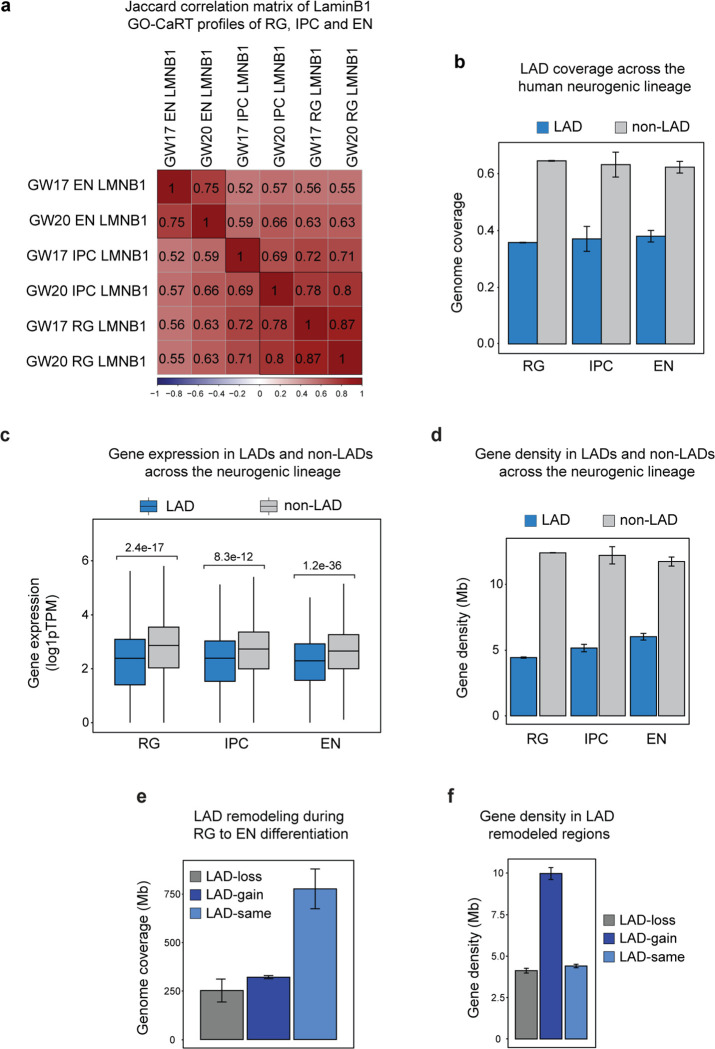
Extended Data Fig. 3. Various genomic features of LADs across the neurogenic lineage (related to Figure 1).
a, Jaccard correlation between LaminB1 GO-CaRT of RG, IPC and EN isolated by FANS from GW17 and GW20 brain cortex. b, Percent LAD coverage in RG, IPC and EN. Standard deviation between GW17 and GW20 time points. c, Box plot depicting average gene expression in LADs (RG, n= 4947; IPC, n= 5462; EN, n= 6929) and non-LADs (RG, n= 24593; IPC, n= 24057; EN, n= 22590) as determined by RNA-seq. n, number of genes. P values determined by Wilcoxon rank sum test. Boxes show the range from lower (25th percentile) to upper quartiles (75th percentile), with the median line (50th percentile); whiskers extend 1.5 times the inter-quartile range from the bounds of the box. d, Gene density in LADs and non-LADs across the neurogenic lineage. e, Genome coverage of LAD remodeling during the differentiation of RG to EN. f, Gene density in LADs that are lost, gained, or remain unchanged during RG to EN differentiation.

