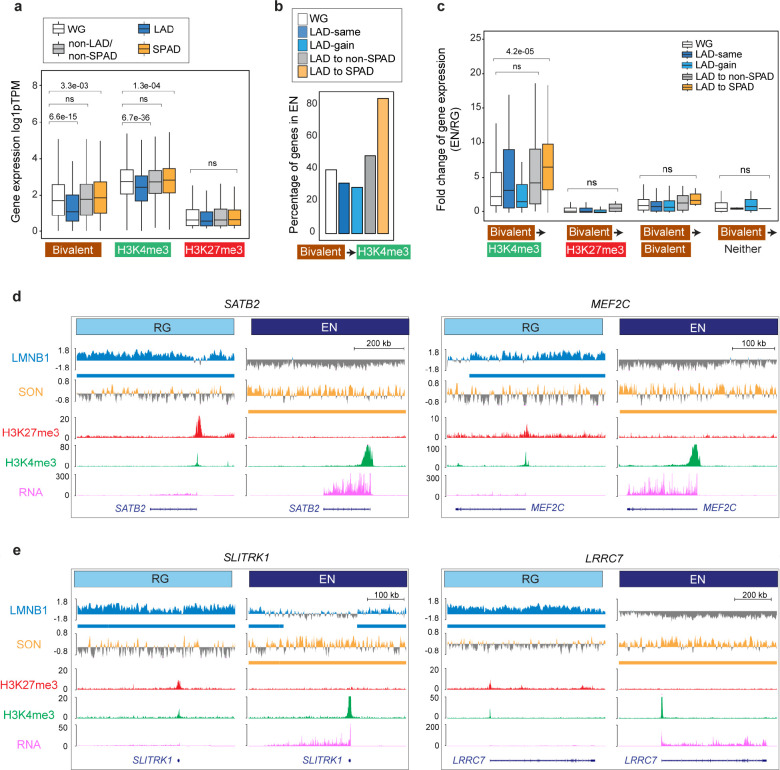
Figure 4. LAD and SPAD dynamics regulate the bivalent chromatin state.
a, Box plot showing average gene expression of RG bivalent (n = 1873), H3K4me3-monovalent (n = 5014), and H3K27me3-monovalent (n = 582) genes in LADs, SPADs, non-LAD/non-SPADs and the whole genome (WG) in RG. n, number of genes across the WG; P values determined by Wilcoxon rank sum test. Boxes show the range from lower quartiles (25th percentile) to upper quartiles (75th percentile), with the median line (50th percentile); whiskers extend 1.5 times the interquartile range from the bounds of the box. b, Percentage of RG bivalent genes that resolve to the H3K4me3-monovalent state in EN based on LAD to SPAD dynamics. c, Fold-change of expression of bivalent genes that resolve to the H3K4me3-monovalent (n = 705), H3K27me3-monovalent (n = 207), remain bivalent (n = 802), or lose both marks (n = 43) during RG to EN differentiation based on LAD to SPAD dynamics. n, number of genes across the WG; P values determined by Wilcoxon rank sum test. Boxes show the range from lower quartiles (25th percentile) to upper quartiles (75th percentile), with the median line (50th percentile); whiskers extend 1.5 times the interquartile range from the bounds of the box. d, e, LaminB1 GO-CaRT, SON GO-CaRT, H3K27me3, H3K4me3 (CUT&RUN) and RNA-seq tracks at some example RG LAD bivalent genes that relocate to SPADs in EN and resolve to the H3K4me3-monovalent with strong transcriptional upregulation. These genes include key transcriptional factors, SATB2, MEF2C (D) and synapse genes, SLITRK1 and LRRC7 (E). Related data in Extended Data Fig. 7.

