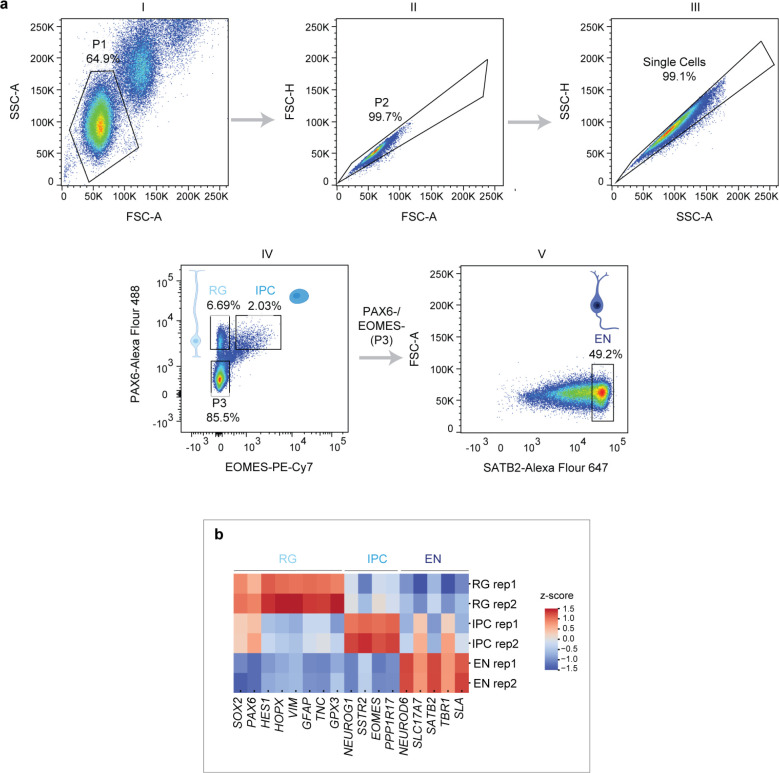
Extended Data Fig. 1. Flow cytometry gating strategy for isolation of RG, IPC and EN and gene expression analysis (related to Figure 1).
a, Representative gating strategy for FANS-based isolation of RG, IPC and EN from mid-gestational human brain cortex. Nuclei were separated from debris by forward scatter area (FSC-A) versus side scatter area (SSC-A) (P1, plot I). Single cells (singlets) were then selected using two gates based on area versus height of the forward scatter (FSC-A vs. FSC-H, plot II) and side scatter (SSC-A vs. SSC-H, plot III). RG populations were isolated by gating on PAX6-Alexa Fluor 488 staining and IPC by gating on PAX6-Alexa Fluor 488 and EOMES-PE-Cy7 staining (plot IV). EN were isolated from PAX6/EOMES negative population (P3) by gating on SATB2-Alexa Fluor 647 staining (plot V). b, Heatmap showing the expression (row normalized) of key marker genes in RG, IPC and EN isolated by FANS from GW20 cortex. R1 and R2 indicate two replicates.

