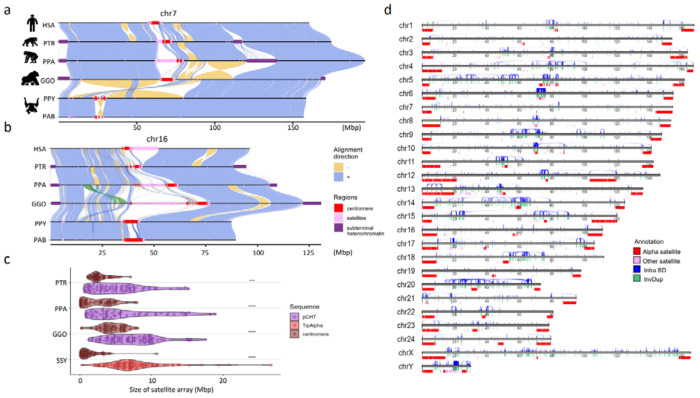
Figure 1. Chromosomal-level assembly of complete great ape genomes.
a) A comparative ape alignment of human (HSA) chromosome 7 with chimpanzee (PTR), bonobo (PPA), gorilla (GGO), Bornean and Sumatran orangutans (PPY and PAB) shows a simple pericentric inversion in the Pongo lineage (PPY and PAB) and b) HSA chromosome 16 harboring complex inversions. Each chromosome is compared to the chromosome below in this stacked representation using the tool SVbyEye (https://github.com/daewoooo/SVbyEye). Regions of collinearity and synteny (+/blue) are contrasted with inverted regions (−/yellow) and regions beyond the sensitivity of minimap2 (homology gaps), including centromeres (red), subterminal/interstitial heterochromatin (purple), or other regions of satellite expansion (pink). A single transposition (green in panel b) relocates ~4.8 Mbp of gene-rich sequence in gorilla from human chromosome 16p13.11 to human chromosome 16p11.2. c) Distribution of assembled satellite blocks for centromere (alpha) and subterminal heterochromatin including, African great ape’s pCht or siamang’s (SSY) α-satellite, shows that subterminal heterochromatin are significantly longer in ape species possessing both heterochromatin types (One-sided Wilcoxon ranked sum test; **** p< 0.0001; *** p< 0.001). d) Schematic of the T2T siamang genome highlighting segmental duplications (Intra SDs; blue), inverted duplications (InvDup; green), centromeric, subterminal and interstitial α-satellites (red), and other satellites (pink).

