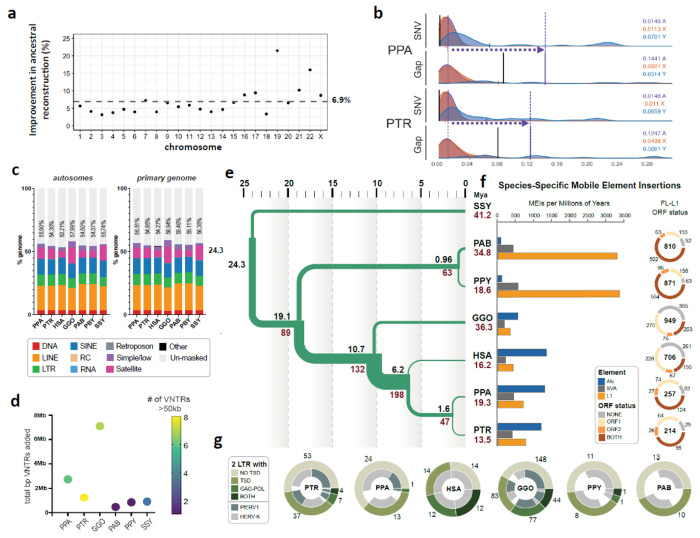
Figure 2. Genome resource improvements.
a) Improvement in the ancestral allele inference by Cactus alignment over the Ensembl/EPO alignment of the T2T ape genomes. b) Genome-wide distribution of 1 Mbp single-nucleotide variant (SNV)/gap divergence between human and bonobo (PPA)/chimpanzee (PTR) genomes. The purple vertical lines represent the median divergence observed. The horizontal dotted arrows highlight the difference in SNV vs. gap divergence. The black vertical lines represent the median of allelic divergence within species. c) Total repeat content of ape autosomes and the primary genome including chrX and Y. d) Total base pairs of previously unannotated VNTR satellite annotations added per species. The color of each dot indicates the number of newly annotated satellites, out of 159, which account for more than 50 kbp in each assembly. (Table Repeat S2). e) Demographic inference. Black and red values refers to speciation times and effective population size (Ne), respectively. For Ne, values in inner branches refer to TRAILS estimates, while that of terminal nodes is predicted via msmc2, considering the harmonic mean of the effective population size after the last inferred split. f) (Left) Species-specific Alu, SVA and L1 MEI counts normalized by millions of years (using speciation times from (2e)). (Right) Species-specific Full-length (FL) L1 ORF status. The inner number within each circle represents the absolute count of species-specific FL L1s. g) Species-specific ERV comparison shows that the ERV increase in gorilla and chimpanzee lineages is due primarily to PTERV1 expansions.

