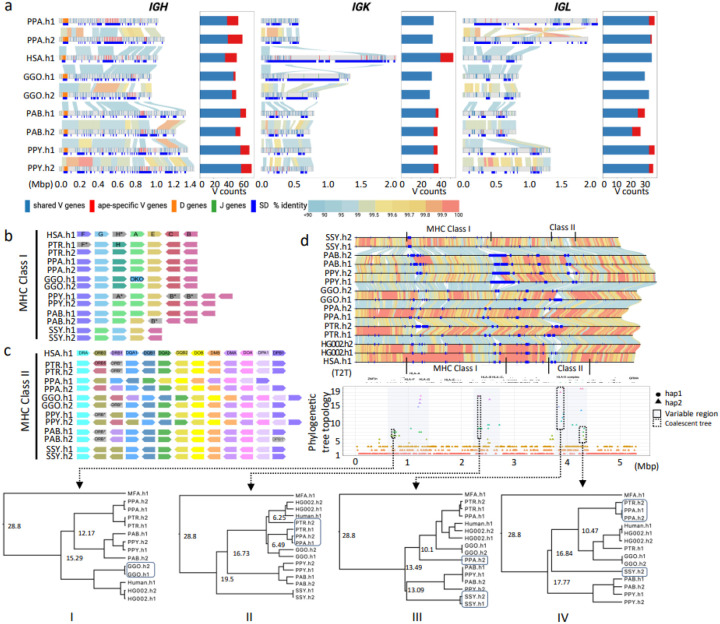
Figure 3. IG and MHC genome organization in apes.
a) Annotated haplotypes of IGH, IGK and IGL loci across four primate species and one human haplotype (HSA.h1 or T2T-CHM13). Each haplotype is shown as a line in the genome diagram where the top part shows positions of shared V genes (blue), ape-specific V genes (red), D genes (orange), and J genes (green) and the bottom part shows segmental duplications (SDs) that were computed for a haplotype pair of the same species and depicted as dark blue rectangles. Human SDs were computed with respect to the GRCh38.p14 reference. Alignments between pairs in haplotypes are shown as links colored according to their percent identity values: from blue (<90%) through yellow (99.5%) to red (100%). The bar plot on the right from each genome diagram shows counts of shared and ape-specific V genes in each haplotype. b and c) show schematic representation of MHC locus organization for MHC-I and MHC-II genes, respectively, across the six ape haplotypes (PTR.h1/h2, PPA.h1/h2, GGO.h1/h2, PPY.h1/h2, PAB.h1/h2, SSY.h1/2) and human (HSA.h1). Only orthologs of functional human HLA genes are shown. Loci naming in apes follows human HLA gene names (HSA.h1), and orthologs are represented in unique colors across haplotypes and species. Orthologous genes that lack a functional coding sequence are grayed out and their name marked with an asterisk. One human HLA class I pseudogene (HLA-H) is shown, because functional orthologs of this gene were identified in some apes. d) Pairwise alignment of the 5.31 Mbp MHC region in the genome, with human gene annotations and MHC-I and MHC-II clusters. Below is the variation in phylogenetic tree topologies according to the position in the alignment. The x-axis is the relative coordinate for the MHC region and the y-axis shows topology categories for the trees constructed. The three prominent sub-regions with highly discordant topologies are shown through shaded boxes. Four sub-regions (1–4) used to calculate coalescence times are shown with dashed boxes.

