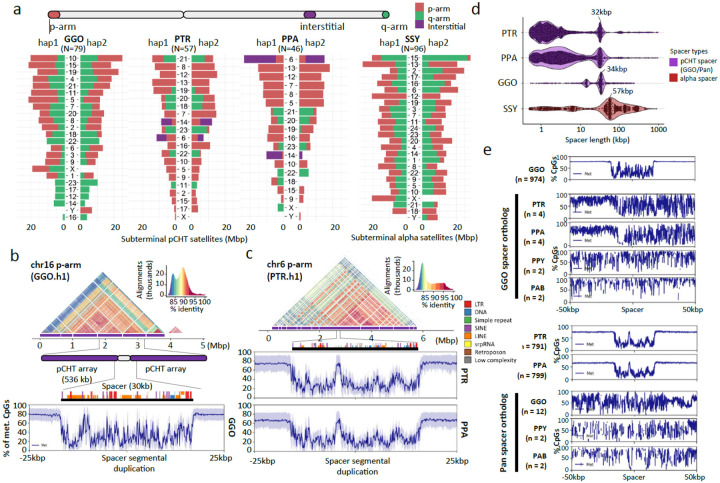
Figure 8. Subterminal heterochromatin analyses.
a) Overall quantification of subterminal pCht/α-satellites in the African great ape and siamang genomes. The number of regions containing the satellite is indicated below the species name. The pChts of diploid genomes are quantified by Mbp, for ones located in p-arm, q-arm, and interstitial, indicated by orange, green, and purple. Organization of the subterminal satellite in b) gorilla and c) pan lineages. The top shows a StainedGlass alignment plot indicating pairwise identity between 2 kbp binned sequences, followed by the higher order structure of subterminal satellite unit, as well as the composition of the hyperexpanded spacer sequence and the methylation status across the 25 kbp up/downstream of the spacer midpoint. d) Size distribution of spacer sequences identified between subterminal satellite arrays. e) Methylation profile of the subterminal spacer SD sequences compared to the interstitial ortholog copy.

