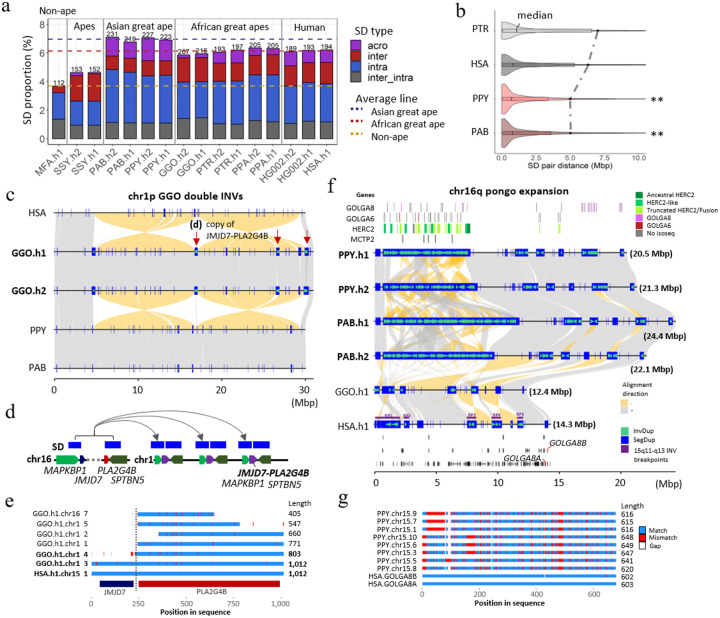
Figure 9. Ape SD content and new genes.
a) Comparative analysis of primate SDs comparing the proportion of acrocentric (purple), interchromosomal (red), intrachromosomal (blue), and shared inter/intrachromosomal SDs (gray). The total SD Mbp per genome is indicated above each histogram with the colored dashed lines showing the average Asian, African great ape, and non-ape SD (MFA=Macaca fascicularis78; see Fig.SD.S2 for additional non-ape species comparison). b) A violin plot distribution of pairwise SD distance to the closest paralog where the median (black line) and mean (dashed line) are compared for different apes (see Fig. SD.S3 for all species and haplotype comparisons). An excess of interspersed duplications (p<0.001 one-sided Wilcoxon rank sum test) is observed for chimpanzee and human when compared to orangutan. c) Alignment view of chr1 double inversion. Alignment direction is indicated by + as gray and – as yellow. SDs as well as those with inverted orientations are indicated by blue rectangles and green arrowheads. The locations in which the JMJD7-PLA2G4B gene copy was found are indicated by the red arrows. d) duplication unit containing three genes including JMJD7-PLA2G4B. e) Multiple sequence alignment of the translated JMJD7-PLA2G4B. Match, mismatch and gaps are indicated by blue, red and white. Regions corresponding to each of JMJD7 or PLA2G4B are indicated by the track below. f) Alignment view of chr16q. The expansion of GOLGA6/8, HERC2, and MCTP2 genes are presented in the top track. 16q recurrent inversion breakpoints are indicated in the human genome. The track at the bottom indicates the gene track with GOLGA8 human ortholog in red. g) Multiple sequence alignment of the translated GOLGA8.

