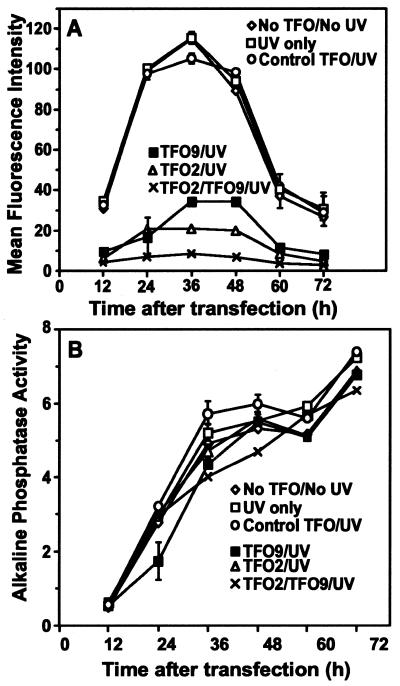
Figure 3.
Rhodopsin–GFP fluorescence and alkaline phosphatase activity over time. (A) The mean fluorescence intensity of cells transfected with various plasmid samples was determined by FACS analysis and plotted (arbitrary units) as a function of time after transfection. (B) Alkaline phosphatase activity was determined from an aliquot of the cell medium from each sample. Activity, monitored by the fluorescence intensity of the dephosphorylated substrate and described by an arbitrary number, is plotted as a function of time after transfection. Data points represent the average of two parallel experiments with the range of values indicated by error bars, where they exceed the size of the symbol.

