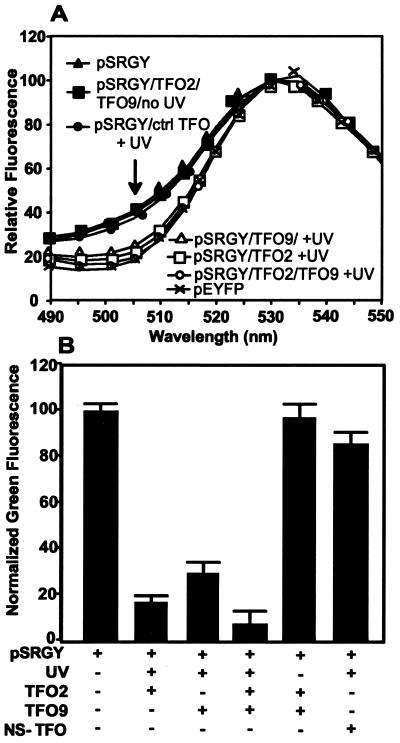
Figure 4.
Expression of pEYFP (yellow) and pSRGY (green and yellow). (A) Emission spectra of cells transfected with pSRGY treated as indicated or with untreated pEYFP, normalized to emission at 530 nm. (B) Normalized green fluorescence at 505 nm, calculated from the emission spectra as described in the text.

