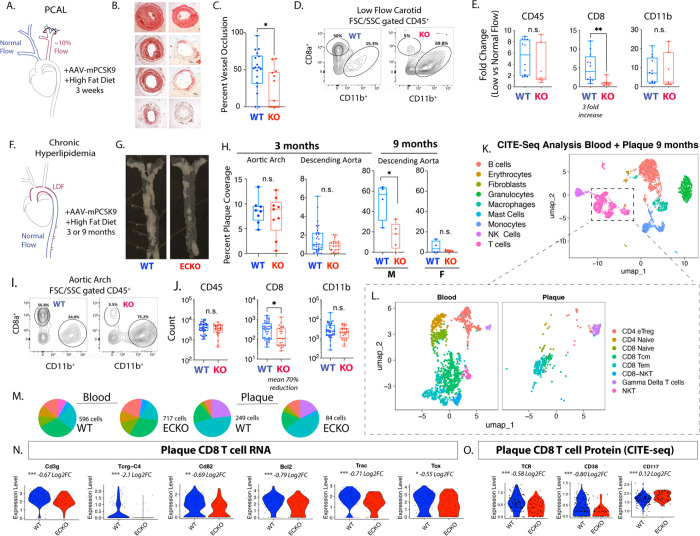
Figure 4. Endothelial deletion of Elavl1 reduces CD8 T cell numbers and activation in plaque progression.
(A-C) Analysis of atherosclerotic plaque in ligated vessels 3 weeks post-PCAL; N=18 WT, N=12 EC-KO. (A) Schematic of PCAL model. (B) Examples of OilRedO stained cross-sections of the low flow LCA. (C) Quantification of plaque as percent vessel occlusion. (D) Flow Cytometry plots of size-gated CD45 cells isolated from atherogenic LCA. (E) Fold-increase in the low flow artery vs. contralateral normal flow control in the number of CD45+, CD45+CD8+, and CD45+CD11b+ cells. N=12 WT, N=7 EC-KO. (F-H) Analysis of atherosclerotic plaque in aortas of mice collected after 3 months or 9 months of hyperlipidemia. (G) Representative images of male aortas at 9 months hyperlipidemia. (H) Quantification of plaque as percent vessel coverage in the aortic arch and descending aorta. Males and females are separated in 9 month data, since differences could be observed at this time point in the hypercholesteremia induce (I&J) Flow Cytometry plots and quantitation of aortic arch after 3 months of hyperlipidemia. N=38 WT, N=26 EC-KO. (K-O) CITE-seq analysis of blood and aortic CD45+ cells at 9 months hyperlipidemia. ECKO and WT mice, N= 7 WT, N=7 ECKO. (K) Leiden clustering of all cells with annotation by RNA and protein labels, each dot represents one cell. (L) T cell subset, organized by tissue of origin. (M) Pie charts showing the total number and ratios of the T cell subsets in blood and in aortic tissue, colors as indicated in L. (N-O) Violin plots of gene expression (N, RNA) or protein expression (O, Protein CITE-seq) of plaque CD8 subcluster from (L). (C,E,H,J) *p<0.05, **p<0.01 by Mann-Whitney test. (N) Unadjusted p-values, *p<0.05, **p<0.01, p<0.001 by Student’s t-test, Log2FC from Seurat analysis.

