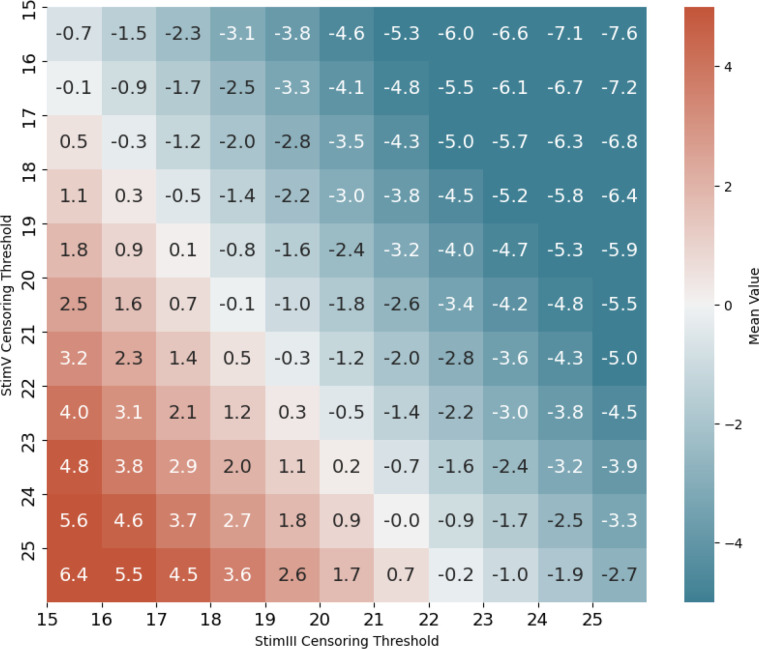
Figure 1. Mean TD Differences Between StimIII and StimV Pairs Across Censoring Thresholds.
Heatmap depicting the average total deviation difference between pairs of stimulus size III and stimulus size V points across varying censoring thresholds where at least one stimulus was censored. The optimal censoring thresholds were identified at 21 dB for stimIII and 24 dB for stimV.

