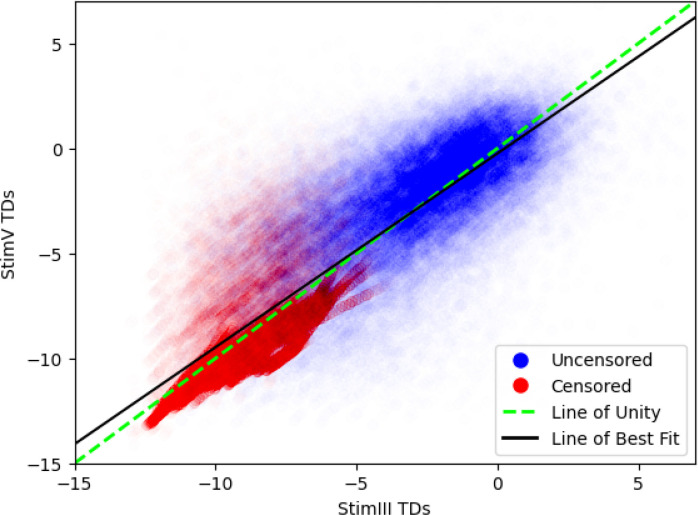
Figure 3. Scatterplot of TD Pairs Between StimIII and StimV.
Pairs of total deviation values from stimulus size III and stimulus size V visual fields. Data points are colored based on whether at least one of the pair is censored. The dotted green line represents the line of unity (y = x). The black line of best fit (y = −0.24 + 0.92x) demonstrates a strong linear relationship between the two stimuli (r2 = 0.70). Data points are made transparent for improved visibility and to illustrate relative density.

