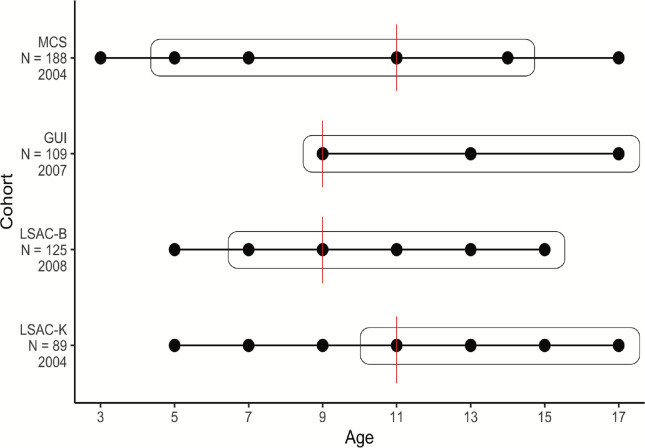
Extended Figure 1:
Schematic diagram of the cohorts included in the study and the ages when data was collected for SDQ scores (dots) and autism diagnosis (in boxes). MCS = Millennium Cohort Study; GUI = Growing up in Ireland (cohort ‘98); LSAC-B = Longitudinal Study of Australian Children (Birth cohort); LSAC-K = Longitudinal Study of Australian Children (Kindergarten cohort). Sample sizes and the year of initial SDQ data collection for each cohort are shown on the ordinate axis. The age cutoff used in the Latent Growth Curve Models for each cohort is indicated by a red line.

