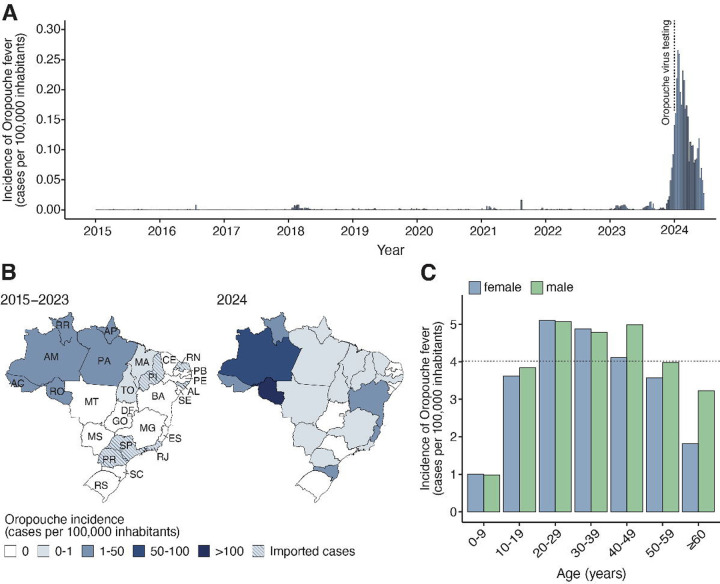
Figure 1. Spatial-temporal dynamics of Oropouche fever between 2015 and 2024 in Brazil.
(A) Incidence of laboratory-confirmed Oropouche fever cases per epidemiological week in all 26 Brazilian States and the Federal District, from epidemiological week 1 of 2015 (04 to 10 January) to epidemiological week 26 of 2024 (23 to 29 June). The dashed line indicates the implementation of OROV diagnosis across all Central Public Health Laboratories in Brazil. (B) Maps were colored according to the incidence of laboratory-confirmed Oropouche fever cases by federal unit between January 2015 and December 2023 (left) and January to June 2024 (right). AC=Acre. AL=Alagoas. AM=Amazonas. AP=Amapá. BA=Bahia. CE=Ceará. ES=Espírito Santo. DF=Distrito Federal (Federal District). GO=Goiás. MA=Maranhão. MG=Minas Gerais. MS=Mato Grosso do Sul. MT=Mato Grosso. PA=Pará. PB=Paraíba. PE=Pernambuco. PI=Piauí. PR=Paraná. RJ=Rio de Janeiro. RN=Rio Grande do Norte. RO=Rondônia. RR=Roraima. RS=Rio Grande do Sul. SC=Santa Catarina. SE=Sergipe. SP=São Paulo. TO=Tocantins. (C) Oropouche fever incidence based on the age-sex distribution of cases from 2015 to 2024.

