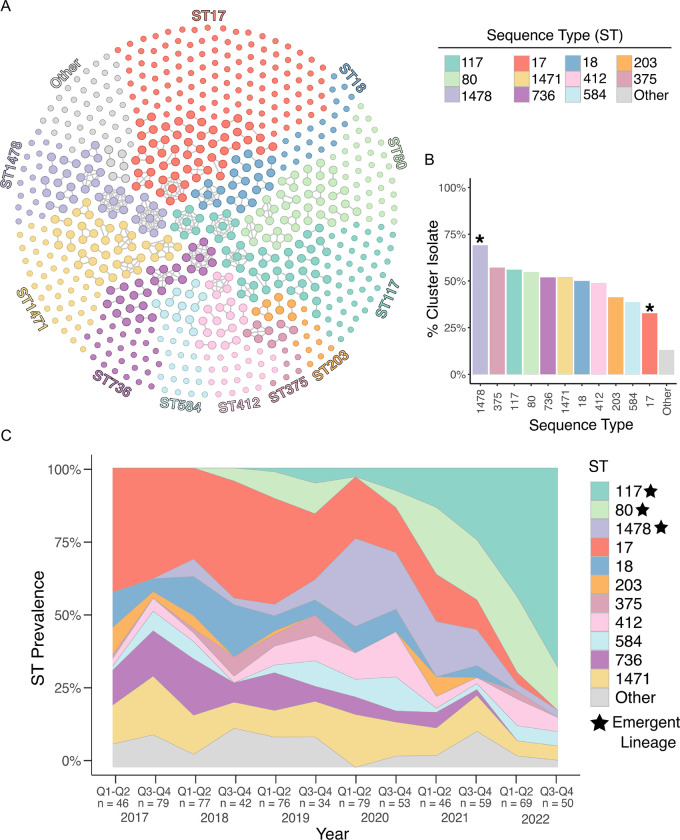
Figure 1: Population structure and temporal dynamics of VREfm at UPMC over 6 years.
(A) Cluster network diagram of 710 sequenced VREfm genomes constructed using Gephi v0.10. Isolates are grouped and colored by multilocus sequence type (ST). Isolates that fall within putative transmission clusters (≤ 10 SNPs) are connected with grey lines. (B) Prevalence of cluster isolates within different STs. Asterisks mark STs that show a higher or lower percentage of clustered isolates compared to the total collection (p < 0.004). (C) Biannual distribution of STs. Q1-Q2 = January-June; Q3-Q4 = July-December. The number of samples within each sample period is noted below.

