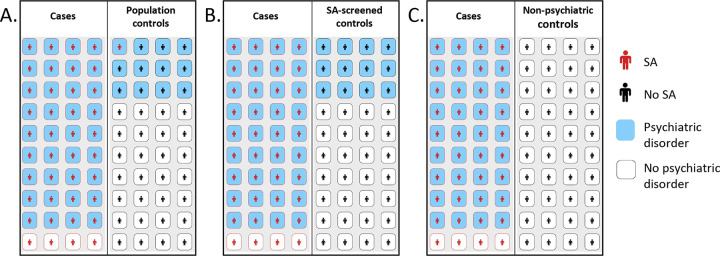
Figure 1: Schematic of comparison between SA cases versus potential control groups.
A-C. The left panels represent SA cases and the right panels represent the control group. Amongst SA cases, the prevalence of psychiatric disorders is 0.9. A. The population control group displays psychiatric disorders at a prevalence of 0.3 and SA at a prevalence of 0.02. B. The SA-screened control group displays psychiatric disorders at a prevalence of 0.3. C. The non-psychiatric control group assumes a prevalence of 0 for both psychiatric disorders and SA.

