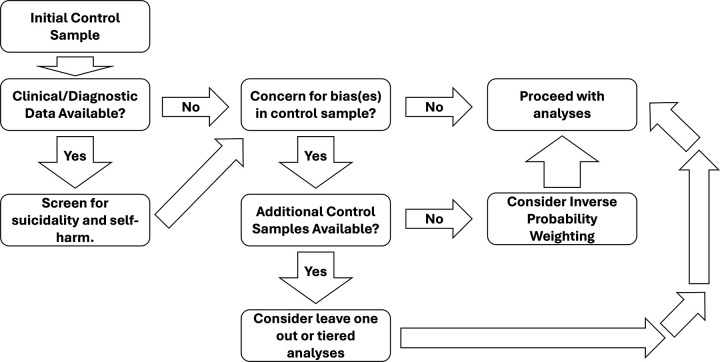
Figure 2: Schematic example of sample processing.
Diagram representing an example processing of a control sample for a suicide phenotype study. Processing of the control samples varies based on concerns about control quality, available data, and separate control samples. Controls with phenotypic data should be screened for SI/SA/SD/NSSI. If multiple control sets are available and there are quality concerns, consider leave-one-out analyses. If some control sets are considered unbiased, perform tiered analyses, starting with the most reliable. For a single control sample with bias concerns, use inverse probability weighting based on selection probability for comparison groups.

