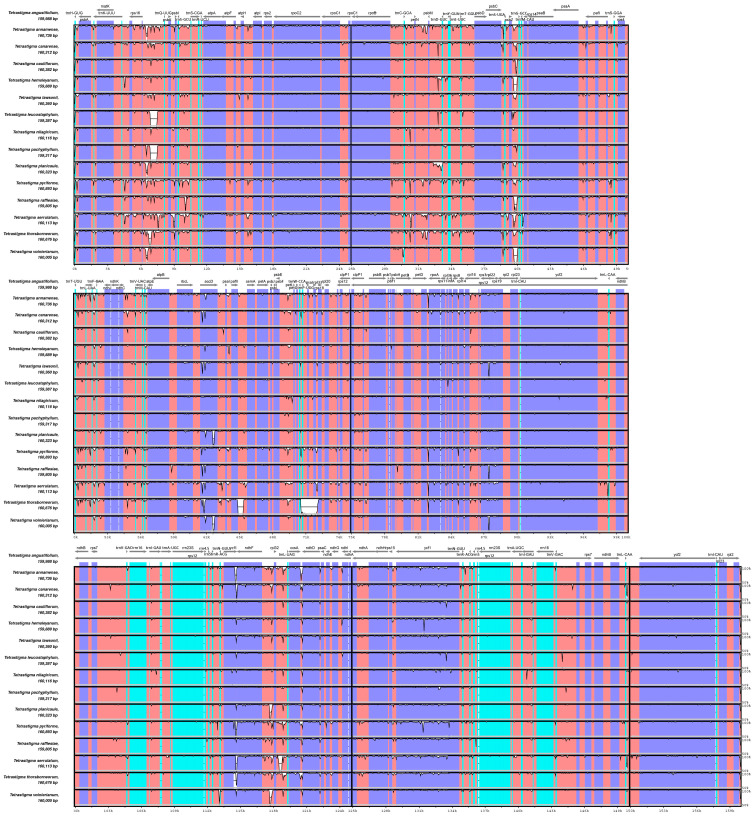
Figure 5.
Visualization of chloroplast genome alignment of 14 Tetrastigma species, using T. angustifolium as a reference. The vertical scale represents the percentage of identity, ranging from 50% to 100%. The horizontal axis denotes the coordinates within the chloroplast genome. Colors are used to indicate distinctive features.

